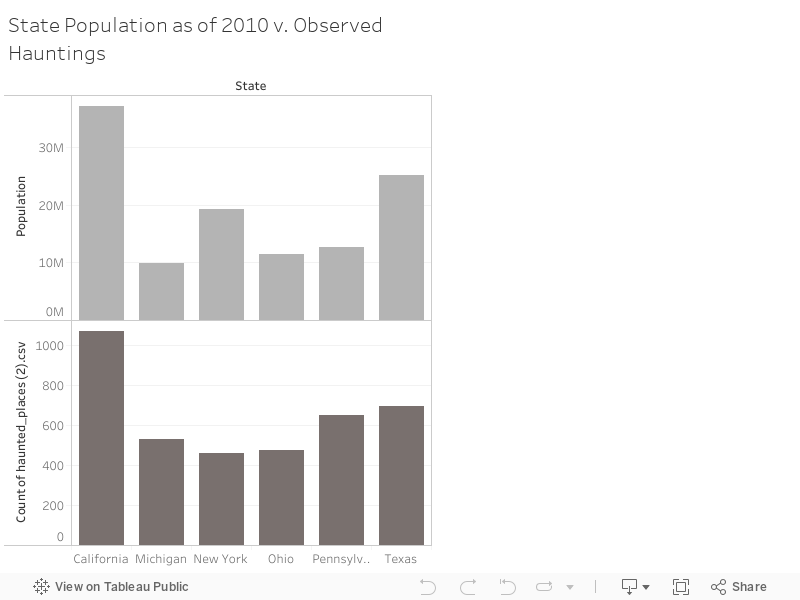
I was finally able to get the population dataset in Tableau and finished my visualizations! It took a long time to sort some of the data, but it came together nicely. I am still deciding on which Types of Haunted Places chart I should use. I feel it is important to include the other category in the chart, but the second chart without the other category is much easier to read. I started my paper to go with the visualization. All I have left is to finish putting the two together.
As for recording a video for next week, I will most likely look at setting up a screen share on zoom to record my presentation. Then I can go back and edit the video before sharing it with everyone.
<script type='text/javascript'> var divElement = document.getElementById('viz1619721109106'); var vizElement = divElement.getElementsByTagName('object')[0]; vizElement.style.width='100%';vizElement.style.height=(divElement.offsetWidth*0.75)+'px'; var scriptElement = document.createElement('script'); scriptElement.src = 'https://public.tableau.com/javascripts/api/viz_v1.js'; vizElement.parentNode.insertBefore(scriptElement, vizElement); </script>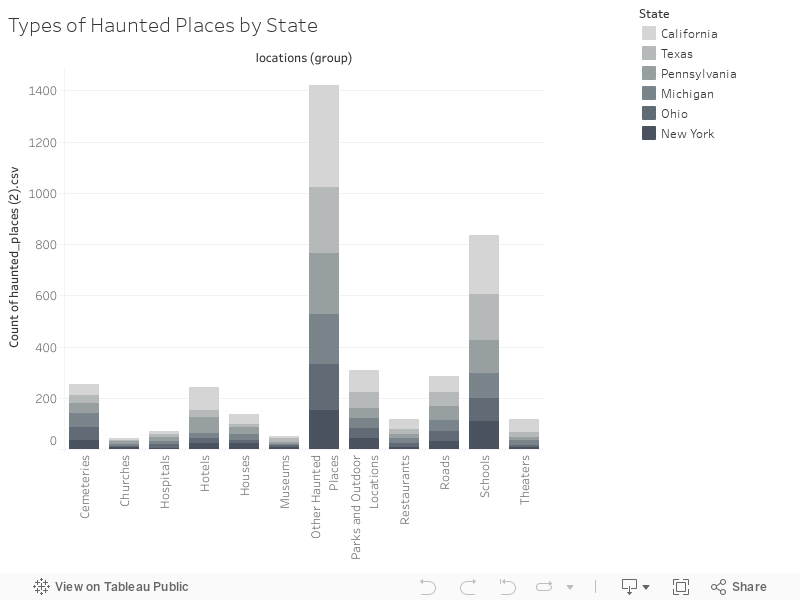
<script type='text/javascript'> var divElement = document.getElementById('viz1619721155093'); var vizElement = divElement.getElementsByTagName('object')[0]; vizElement.style.width='100%';vizElement.style.height=(divElement.offsetWidth*0.75)+'px'; var scriptElement = document.createElement('script'); scriptElement.src = 'https://public.tableau.com/javascripts/api/viz_v1.js'; vizElement.parentNode.insertBefore(scriptElement, vizElement); </script>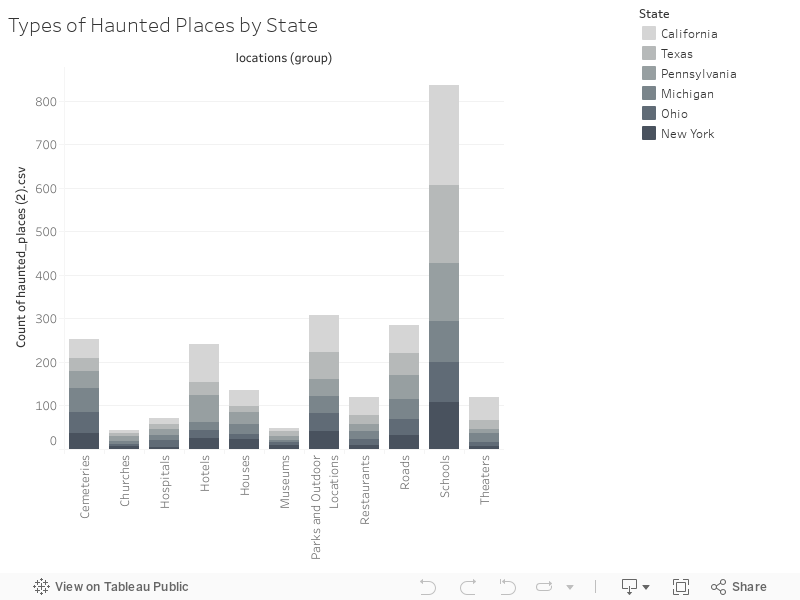
<script type='text/javascript'> var divElement = document.getElementById('viz1619721233279'); var vizElement = divElement.getElementsByTagName('object')[0]; vizElement.style.width='100%';vizElement.style.height=(divElement.offsetWidth*0.75)+'px'; var scriptElement = document.createElement('script'); scriptElement.src = 'https://public.tableau.com/javascripts/api/viz_v1.js'; vizElement.parentNode.insertBefore(scriptElement, vizElement); </script>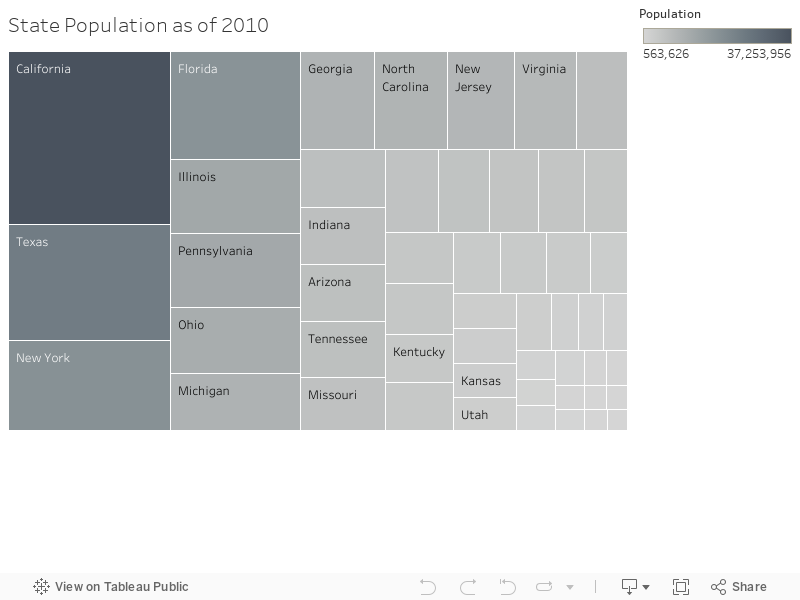
<script type='text/javascript'> var divElement = document.getElementById('viz1619721187430'); var vizElement = divElement.getElementsByTagName('object')[0]; vizElement.style.width='100%';vizElement.style.height=(divElement.offsetWidth*0.75)+'px'; var scriptElement = document.createElement('script'); scriptElement.src = 'https://public.tableau.com/javascripts/api/viz_v1.js'; vizElement.parentNode.insertBefore(scriptElement, vizElement); </script>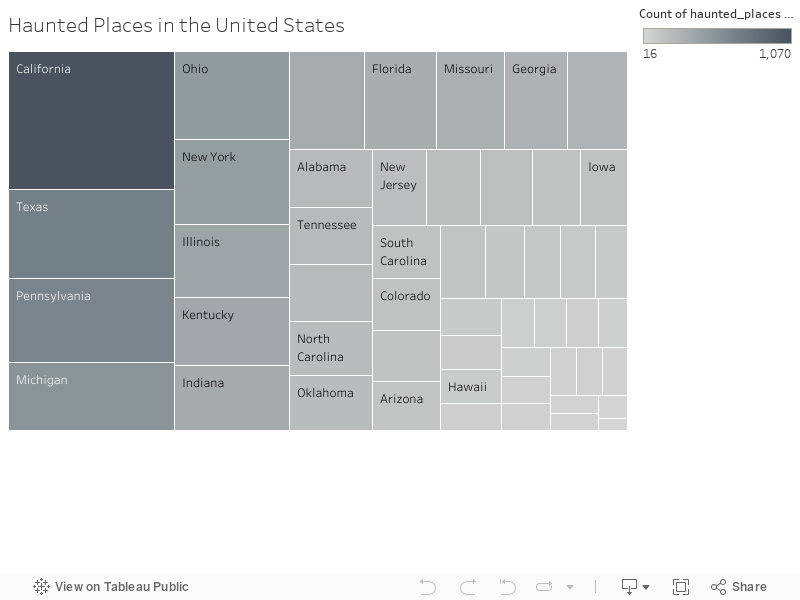
<script type='text/javascript'> var divElement = document.getElementById('viz1619721562848'); var vizElement = divElement.getElementsByTagName('object')[0]; vizElement.style.width='100%';vizElement.style.height=(divElement.offsetWidth*0.75)+'px'; var scriptElement = document.createElement('script'); scriptElement.src = 'https://public.tableau.com/javascripts/api/viz_v1.js'; vizElement.parentNode.insertBefore(scriptElement, vizElement); </script>
One reply on “Module 12: Work”
I agree re: excluding Other in the types of hauntings–it’s much easier to see the other types without Other blowing up the scale. I would also try doing that chart as a side-by-side bar chart rather than a stacked bar chart so that it’s easier to compare between states. Right now it’s hard to see if eg California has more school hauntings that Michigan or whatever.
I also strongly, strongly suggest that now that you’ve got population in your workbook, normalize the number of hauntings by population like shown here: https://dhpracticum21.maevekane.net/2021/04/05/proportions/ Right now just having two bar charts with population and hauntings by state makes it really difficulty to tell if, for example, Michigan is more haunted on average than California. More hauntings by raw numbers could mean that there’s just more people there to report the hauntings (remember the difference between number of earthquakes and number of recorded earthquakes). Finding the proportion of reported hauntings for a consistent population number (like hauntings reported per 100k population) will help you more easily see if small states with low population are more haunted compared to big states with big population.