Requirements
The final project has very few requirements: it must be based on one or more datasets (not on textual archival or secondary research) and it must have an argument. This argument does not need to be presented in essay format, so begin thinking early in the semester about effective presentations we encounter in example projects. Your project should also be interactive in some way: the reader or viewer should be able to interact in some way besides looking and/or viewing links. This can be as simple as a year slider to see how your data changes.
Datasets I have assembled are available here. These will all work for our project, but may need to be cleaned, reformatted, extended, or processed in other ways.
This class emphasizes process over product, so the final project grade puts more weight on development benchmarks than on the final project itself. It’s ok if your project doesn’t ultimately work, but by meeting the development benchmarks you should be able to explain what you tried, why, and what you would do differently. Your journey through your final project will probably be something like this and that’s ok.
You can and should do secondary research to contextualize your data. This may be as simple as figuring out why male indentured servants were listed as “spinsters,” or may extend your data by seeking out additional information through genealogy resources like FamilySearch (free, but requires an account) or Ancestry.com’s New York resources (free if you go through the New York State Library portal and make an account, but limited to select New York items). You can and should contextualize your dataset in a brief overview of the historiography of the issues, time, and place it deals with, and any other scholarship that has been done with that data. If, for example, you were working on the Black Loyalists in the “Book of Negros” dataset, you should contextualize your own data within the relevant literature on loyalists even if none of the specific people in the dataset are named there. Some of our datasets were published online by the authors who compiled the data for their own research, and should be cited in your project.
All projects must be proposed by the end of Module 6, Friday March 19. Projects must be historical in scope, up to the present day. PhD students may use data related to the dissertation project in consultation with me and the dissertation supervisor. MA students may use data obtained via an API, webscraping, or direct download if the source is identified by Friday March 19. As a rule of thumb, your dataset should have at least 1000 records and a minimum of 4-5 columns to make for an interesting project. In general, I discourage the use of metadata collections for the final project because they tell you a bit about archival or museum collection practices that is fairly well known already, and not much else. (This listing for a cookbook is a good example of a metadata collection: the digitized data is about where the cookbook was published and where the physical object is held now, not about the information inside the cookbook).
I will not approve projects that require OCR of images or hand transcription. Your data must be machine readable (that is, accessible by API or webscraping if you do not have a file already) by March 19. If your data is not already digitized (images and pdfs don’t count), you will need to select one of the datasets above.
I will not approve projects using Covid-19 related data, data related to Parler/Gab social media hacks, any data related to right wing extremism or data related to the January 6, 2021 insurrection at the US Capitol. Projects related to these issues do have historical, social, and political value, but I am not willing to supervise them in the context of this class.
Publishing
All projects must be posted online by 11:59PM on Friday May 14. You have some options for publishing, listed here in order of complexity:
- A post on the course blog. This is a good option if you just plan on embedding Tableau or Observable visualizations in a traditional essay format.
- A subdomain of the course website or SUNY space (essentially, your own empty website). This is a good option if you want to get experience setting up a small website on your own and want some control over the look and feel of your project.
- ArcGIS StoryMap. This is an example to give you an idea of what it might look like. This is a good option if you want to include a lot of images and some simple maps.
- ArcGIS Map applet. This is a good option if your main focus is on mapping and you don’t have a lot of images.
- Observable. This is a good option if you want to dig into more complicated visualizations like networks or have more control over your visualizations. (Anything you can do in Tableau, you can do on Observable, but more complicated and with more fine-grained control. It will require learning more javascript, which I am happy to help you with if you set the goal).
- Github Pages with hand-written html and css like we did for our first assignment. This is a good option if you want a lot of detailed control over the look and feel of your project.
- Github Pages with blog software. This is a good option if you’re comfortable with WordPress and want to get a feel for what other kinds of website software are out there without paying for hosting.
All of these options accept embeds from Tableau and Observable.
Regarding footnotes, the modern web is not very good at footnotes. Plan on parenthetical citations with a bibliography following the main body of your project regardless of the platform you choose.
If you choose to publish somewhere besides the course blog, you still need to make a post here with a link so that I know where to find it.
Benchmarks
March 19 / Module 6: Select a dataset to work with
April 5 / Module 9: Project plan
April 12 / Module 10: Visualization first draft
April 19 / Module 11: Refine draft
May 3 / Module 13: Virtual conference presentation
Final projects are due online at 11:59PM on Friday May 14
Inspiration
Below are some digital history projects to give you an idea of some of the possibilities for your own project. The projects listed below are specifically history projects, but the Tableau gallery and Observable trending topics are good places to brainstorm presentation and visualization options. Just remember that analysis should come first–a cool looking visualization may not work for your project because your data is different.
You can also include other webtools to add other elements to your project, like the Knight Lab’s Timeline JS interactive timeline maker, image comparison slider, or story map tool.
You can also take a look at previous final projects for this class (2019 and 2016), but do please note that I have changed some project requirements for this version of the class. If you use one of the datasets I’ve provided, it will be helpful to look through previous class projects and see what worked (or didn’t). If you get inspiration from one of these, make sure to cite and link back in your own project.
Older, static websites
These projects are first generation digital history projects that used the possibilities of the internet as a publishing medium. Although these projects were innovative for their time, they are outdated now because they are static and non-interactive. I present them here as examples of the kinds of projects you should not do for this class.
- UAlbany Campus Buildings Historical Tour
- The Normal School Company & Normal School Company History
- State Street Stories
- Black and Free
- Valley of the Shadow
- People of Colonial Albany
Presentation projects
These projects use the publishing medium of the internet in an updated way. These projects do some interesting things with the medium, like tweeting every 3 minutes as a visualization of how often slave sales occurred in the US, or visually grouping museum objects. However, they lack an argument, and are examples of kinds of projects you should not do for this class. You should strive to do something more than simply present your data online. However, there are some interesting elements here that will give you some ideas about the possibilities of digital projects.
- Last Seen: Finding Family After Slavery
- Every3Minutes
- Coins
- Forms of Attraction: The Data Behind the Forms We Wear
- [Re]Activate Mama Pina’s Correspondence
Mapping Projects
These projects all have a major geographic element. Some, like the Naonaiyaotit Atlas and the Welikia Manahatta Project, attempt to conceptualize space in non-Western ways, while others like Pox Americana or Forced Migration use space to display information more traditionally. All make an argument about change over time or space and are good examples of projects that use both a digital medium and a digital method. These can mostly be reproduced using Tableau.
- Arabella Chapman Project
- Mapping Segregation
- Mapping Violence
- Digital Harlem
- The Negro Traveler’s Green Book
- Visualizing Emancipation
- Forced Migration
- Jamaican Slave Revolt
- Foreign Born Population
- Canals 1820-1860
- The Overland Trails
- Mapping Occupation
- Invasion of America
- Pox Americana
- Naonaiyaotit Traditional Knowledge Project Atlas
- Welikia Manahatta Project
- Layers of London
- Mapping Texts
- Mapping the Gay Guides
- Early Baltimore
- Mapping Gothic France
Network projects
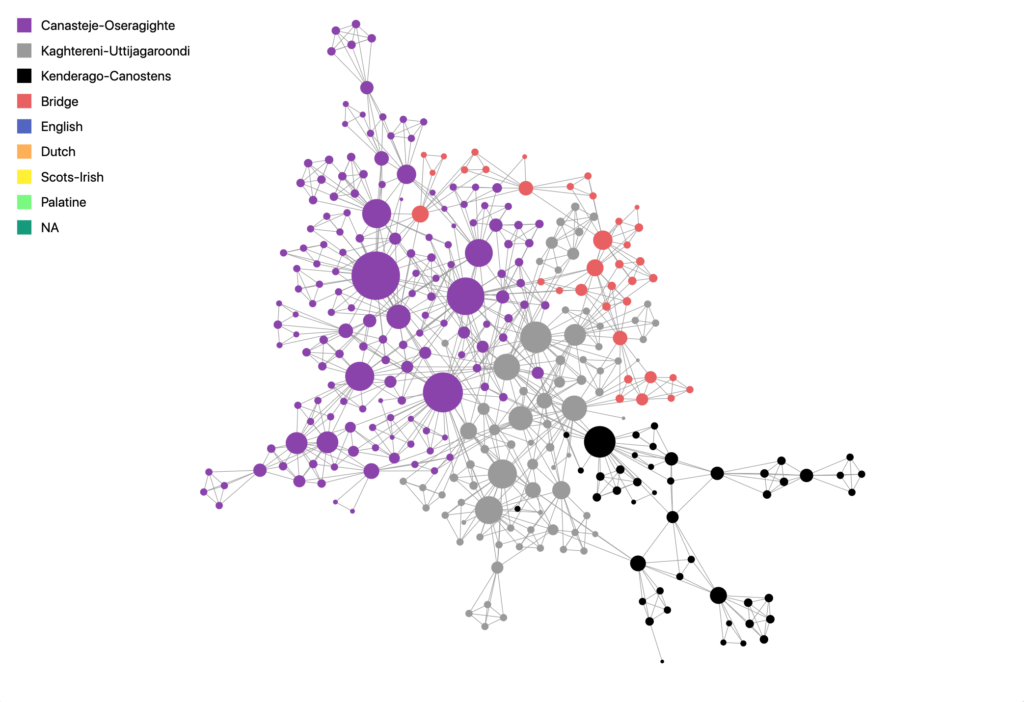
These projects make an argument about connections between people, things, or ideas. They may have an element related to change over time or space as well, but they’re mainly about connections and are good examples of projects that use both a digital medium and a digital method. These kinds of projects would need significant use of Observable.
Image resources
Images help liven up web projects; you’re welcome to use images from a variety of sources as long as you attribute and cite them within your project.
When deciding whether to use an image, you should check its license and copyright status (usually this is listed somewhere on the page displaying the image). In general, public domain and creative commons images are safest to use (this page details the many different kinds of creative commons licenses). You’re not limited to historical images for your project. A project on migration might use modern creative commons photos of landscapes from Flickr; a project on the fur trade might use close-up shots of animal fur or cloth. Think creatively about drawing attention to different parts of your project.
After you select an image to use, you’ll need to either download the image and re-upload it on your chosen publishing platform, or link directly to the image (this is not generally best practice because the host website can go offline and it uses up the host website’s bandwidth in a rude way). If you download images, download the biggest file size available and save it with a name that allows you to properly attribute and cite it after re-uploading. It is best practice to link back to the original place you got the image in your citation. This is a good guide to citing images from different sources in Chicago style.
When using images, it’s also best practice where possible to use a descriptive title and alt-text to describe the image. This ensures that your images are accessible to readers who use screen readers or other assistive devices. Usually titles and alt-text are invisible to readers who are not using assistive devices; the image below has the title “Haudenosaunee network” and the alt-text “Network diagram of Indigenous people connected by baptisms and godparentage of children.” Typically the option to include a title and alt-text are in the image upload interface, but may not be available on all platforms.
Place to look
Most institutions these days have some portion of their collections available online, but the below are good places to start looking for public domain and creative commons images.