Final project time!
This week, and the next three weeks, is your time to work on your final project. I will post some suggested tasks for you in each module, but your time is yours to work on your final project.
| Start | Meet | Post |
| Apr 5 | Apr 7 | Apr 9 |
This is your last week with assigned reading! Everyone should read Fundamentals of Data Visualization, Ch 17-23, excluding chapter 18. We won’t be having a discussion on this, but it’s a good foundation for making good visualizations regardless of the platform you decide to use.
Your time is your own for the rest of the semester. You should have a dataset identified and approved by now, so this week I suggest:
- If using an API, write the program to acquire your data
- Do a data critique to assess what you have to work with
- Extend your data with geographical or gender information if necessary
- Clean your data using OpenRefine. Make good notes as you go about the choices you’re making, and keep an unchanged original copy of your data somewhere separate
- Browse example projects and make note of kinds of comparisons or visualizations you want to try, with the knowledge that not everything will work or work the first time
Wednesday Agenda
At our Wednesday meeting, I will be available to answer questions, help plan your project, and troubleshoot any issues that come up.
Tasks
To help us keep track of everyone’s progress, I will ask you to make a progress post every week for the next four weeks. This week I would like everyone to post by Friday April 9:
- A brief description of the data set you’re using (even if it’s one I provided). If you’re not using data I provided, briefly describe how/where you got it.
- A data critique in google sheets format. Use the format from the Row Description sheet of our Data Critique assignment. If you’re using a dataset someone else did the data critique for, you can copy over their information into your new sheet, but keep their name associated to give credit.
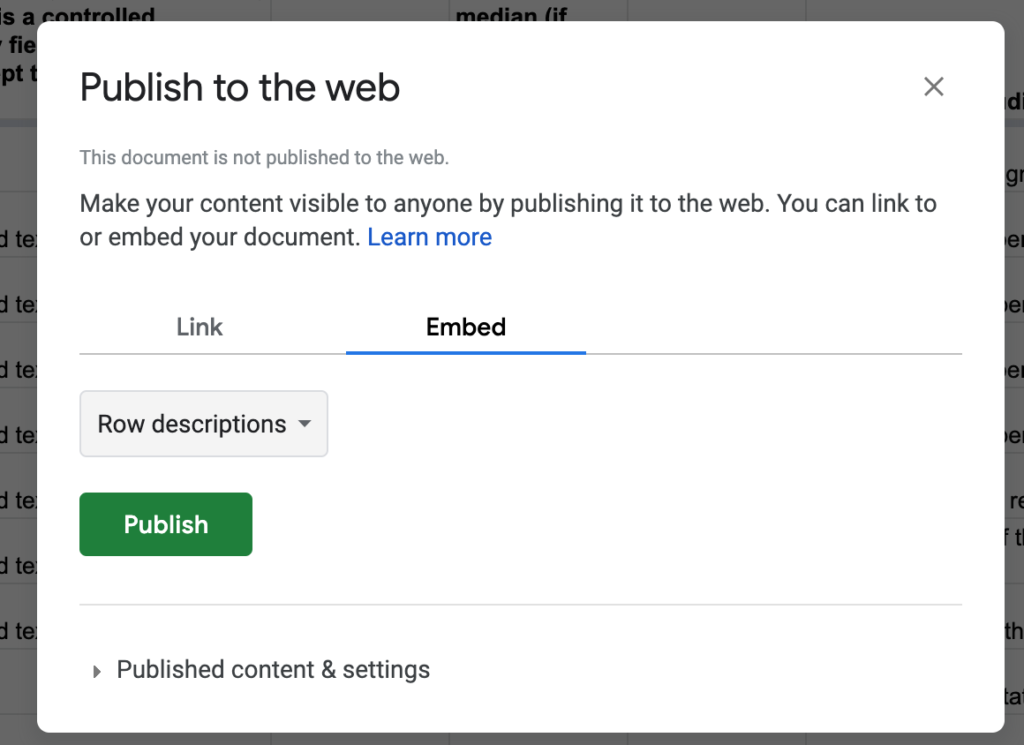
- Embed your data critique spreadsheet in your post by going File > Publish to Web > Embed and select the sheet to embed. After hitting publish, copy the iframe code and paste it into your post using a Custom HTML block (remember that pasting directly will not work!) It should look like the embedded spreadsheet below after you publish, but it will show up as code while you’re editing your post.
- Briefly describe your cleaning choices or plans if you haven’t finished yet (you don’t need to describe every single step or change, but any changes you’ve made should be clear)
- Briefly describe any ways you’re going to extend or change your data by removing data, splitting columns, or fetching geographical data.
- Link to or describe at least two visualizations that you plan to attempt with your data. If you’ve already made sample visualizations in Tableau, you can embed them in the post.
- When publishing your post, use the Portfolios: YourLastName category. For the next four weeks and the final project, you will make a post every week using this category.