I chose to do the lessons in Observable, so here is the Tableau workbook from the first lesson:
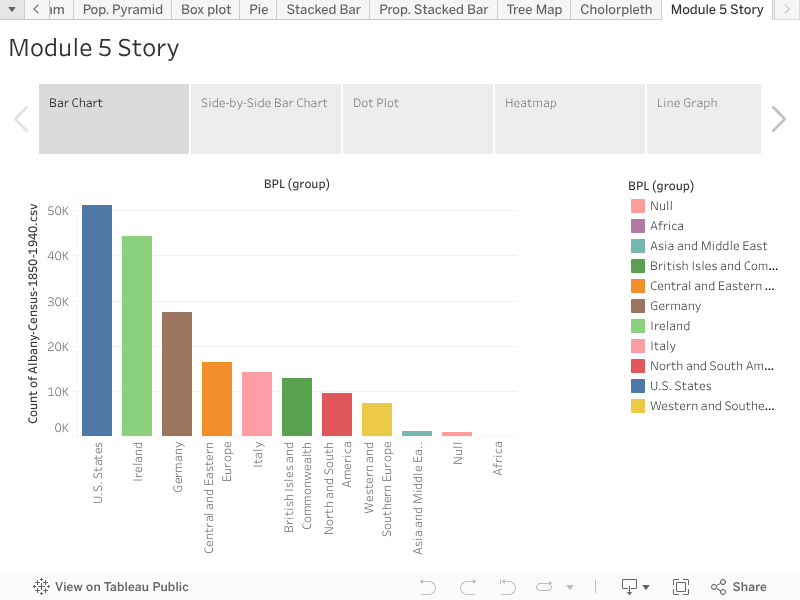
<script type='text/javascript'> var divElement = document.getElementById('viz1615568396334'); var vizElement = divElement.getElementsByTagName('object')[0]; vizElement.style.width='100%';vizElement.style.height=(divElement.offsetWidth*0.75)+'px'; var scriptElement = document.createElement('script'); scriptElement.src = 'https://public.tableau.com/javascripts/api/viz_v1.js'; vizElement.parentNode.insertBefore(scriptElement, vizElement); </script>(I made the workbook into a story, but when I went to embed it into this post, it was static rather than interactive. I changed the block to a custom html and I could click through it here in the post editor, but that didn’t translate to the actual published post! So I just embedded the image of the bar chart with the embed code still visible, and here’s the link to the actual story: 😀)
In terms of an “Aha!” moment: when I remembered the comment that “Order matters!” from the Tree Map section of Tableau, I realized the same applied to the d3.rollup function. It was fun to mess around and roll up different pieces of the data, see how they were nested, and think about out what would produce a readable graph.
In terms of a roadblock, I had a harder time doing the lesson from scratch with a brand new dataset. Parsing how to aggregate the data was interesting, but getting it to display as an actual graph was more frustrating (if I had to guess, it’s because the data I was trying to display wouldn’t graph in a way that made sense- it’s easier in Tableau, since you can just drag things around until a legible graph forms.) While trying to troubleshoot that, though, I discovered Vega-Lite, and at least got to the point where I could graph this:
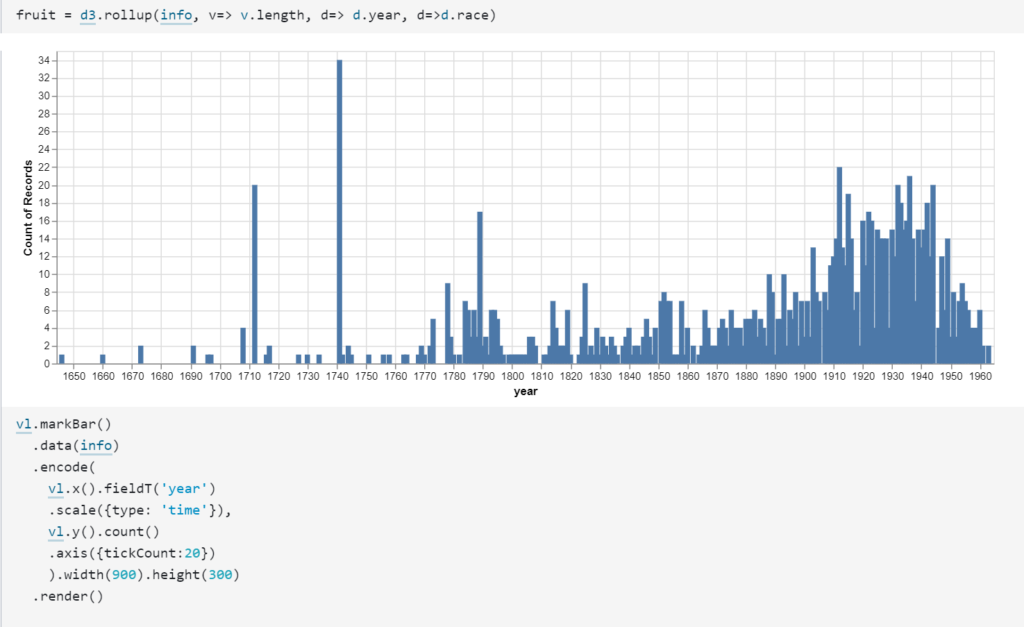
If you noticed the fruit.rollup at the top, I figured that there must be a way to graph mapped elements since Vega-Lite can combo with d3, but I didn’t figure it out yet (as most Vega-Lite tutorials that don’t take place in Observable structure the code differently.)
Overall, the coding elements of the course have been the most fun for me. When I took a coding course in the past, I did very poorly, so getting through those types of assignments successfully was both surprising and extremely gratifying to see how I’ve grown as a student!