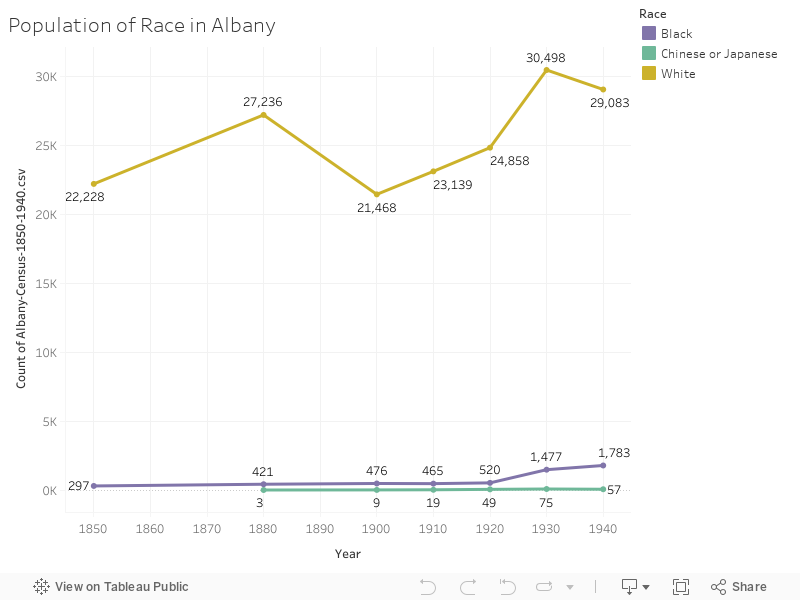
In my Line Graph, I show the population of people in Albany for the entire census. I used race as a filter but excluded Native Americans. I was surprised to find how there was little increase in the population of Black and Japanese and Chinses people, even in the later periods displayed on the chart.
<script type='text/javascript'> var divElement = document.getElementById('viz1616081402589'); var vizElement = divElement.getElementsByTagName('object')[0]; vizElement.style.width='100%';vizElement.style.height=(divElement.offsetWidth*0.75)+'px'; var scriptElement = document.createElement('script'); scriptElement.src = 'https://public.tableau.com/javascripts/api/viz_v1.js'; vizElement.parentNode.insertBefore(scriptElement, vizElement); </script>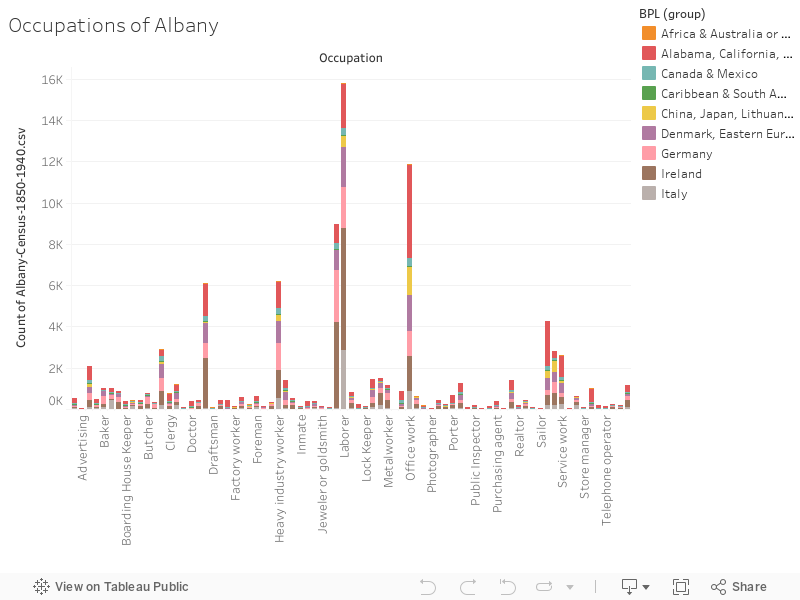
For my Bar Chart, I looked at the Occupations of the Albany census. I filtered the chart with the grouped birthplace. This chart can show the ethnic groups of different occupations during the time of the census. I expected to find groups like Italian and Irish workers to have high Labour intense jobs, as the chart shows.
<script type='text/javascript'> var divElement = document.getElementById('viz1616082048900'); var vizElement = divElement.getElementsByTagName('object')[0]; vizElement.style.width='100%';vizElement.style.height=(divElement.offsetWidth*0.75)+'px'; var scriptElement = document.createElement('script'); scriptElement.src = 'https://public.tableau.com/javascripts/api/viz_v1.js'; vizElement.parentNode.insertBefore(scriptElement, vizElement); </script>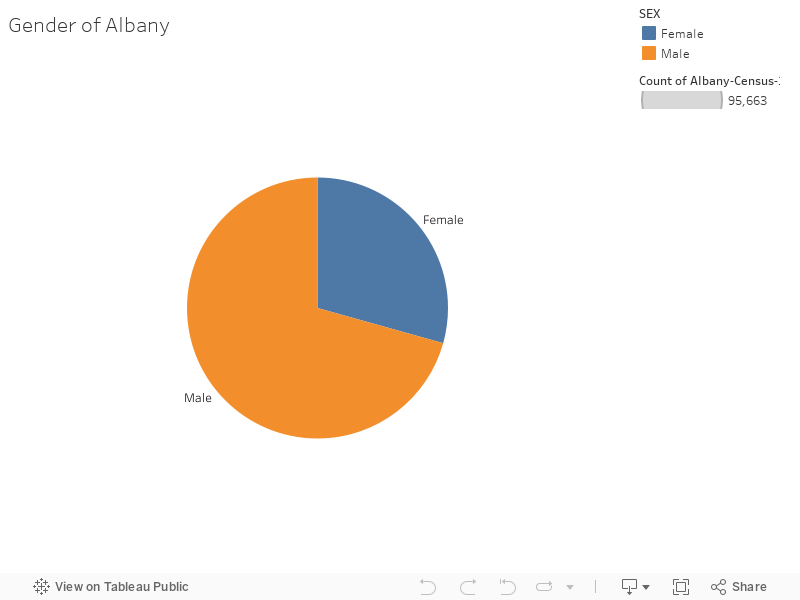
For my Pie Chart, I did a simple comparison of gender in the Albany Census. I was surprised to find a larger male population. I expected it to be a little more even as Albany was a pretty populated area.
<script type='text/javascript'> var divElement = document.getElementById('viz1616082307261'); var vizElement = divElement.getElementsByTagName('object')[0]; vizElement.style.width='100%';vizElement.style.height=(divElement.offsetWidth*0.75)+'px'; var scriptElement = document.createElement('script'); scriptElement.src = 'https://public.tableau.com/javascripts/api/viz_v1.js'; vizElement.parentNode.insertBefore(scriptElement, vizElement); </script>So far, this assignment and our first assignment of creating a website with coding are the ones I have enjoyed the most. I think this is because it is easier to see and understand the results of the coding and data. I am not a big fan of some of the other data fetching and cleaning assignments we have done. I would like to do more of this visual data type of work in the future for a final project.