<script type='text/javascript'> var divElement = document.getElementById('viz1619020450594'); var vizElement = divElement.getElementsByTagName('object')[0]; vizElement.style.width='100%';vizElement.style.height=(divElement.offsetWidth*0.75)+'px'; var scriptElement = document.createElement('script'); scriptElement.src = 'https://public.tableau.com/javascripts/api/viz_v1.js'; vizElement.parentNode.insertBefore(scriptElement, vizElement); </script>
<script type='text/javascript'> var divElement = document.getElementById('viz1619020840585'); var vizElement = divElement.getElementsByTagName('object')[0]; vizElement.style.width='100%';vizElement.style.height=(divElement.offsetWidth*0.75)+'px'; var scriptElement = document.createElement('script'); scriptElement.src = 'https://public.tableau.com/javascripts/api/viz_v1.js'; vizElement.parentNode.insertBefore(scriptElement, vizElement); </script>
One reply on “Initial Visualizations”
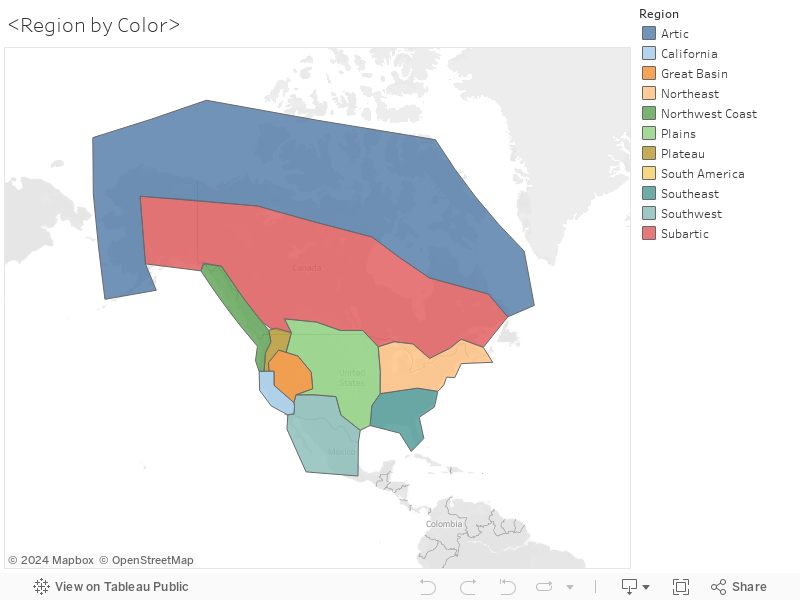
The region shapes look good! If you’re not going to visualize South America, I would totally exclude that from your data in Tableau.
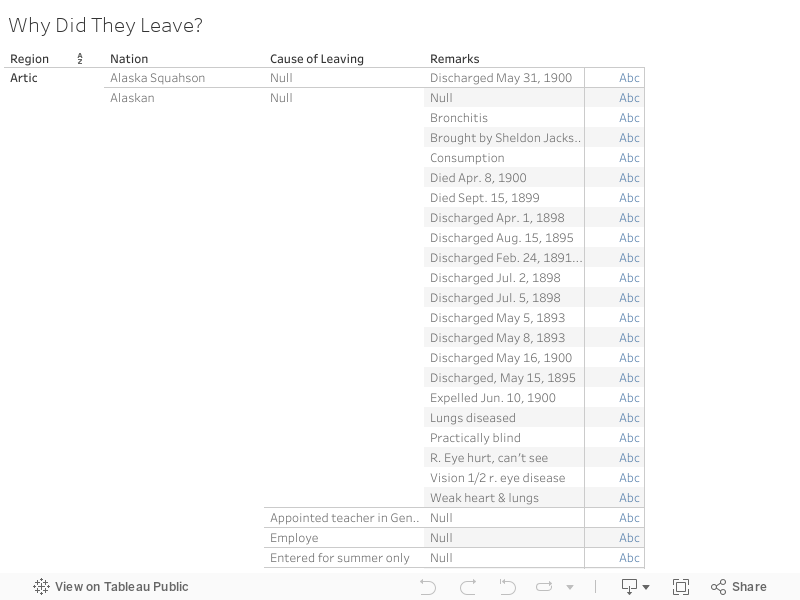
For the Why Did They Leave one, I would work on consolidating that into broad groups like injury, illness, employment, family issues, other, etc, so that your reader doesn’t need to scroll through every single slightly different entry. You can do this in Tableau https://help.tableau.com/current/pro/desktop/en-us/sortgroup_groups_creating.htm or in OpenRefine with special facet: https://dhpracticum21.maevekane.net/2021/04/09/adding-type-columns/