For my final project, I will be using Tableau charts to show my information and data. As of right now, I am kind of leaning towards doing an essay with embedded charts to help explain the types and the descriptions of the different haunting in different locations. This is because trying to narrow down and place some of this information in a chart has proven to be difficult so far, but I might figure out some different options the more I work with it.
So far, I have made a general bar chart to show the number of hauntings in each state. This chart would most likely go with an introduction paragraph to show the hauntings in each state. It would help to provide a brief overview of the number of haunted places in the United States.
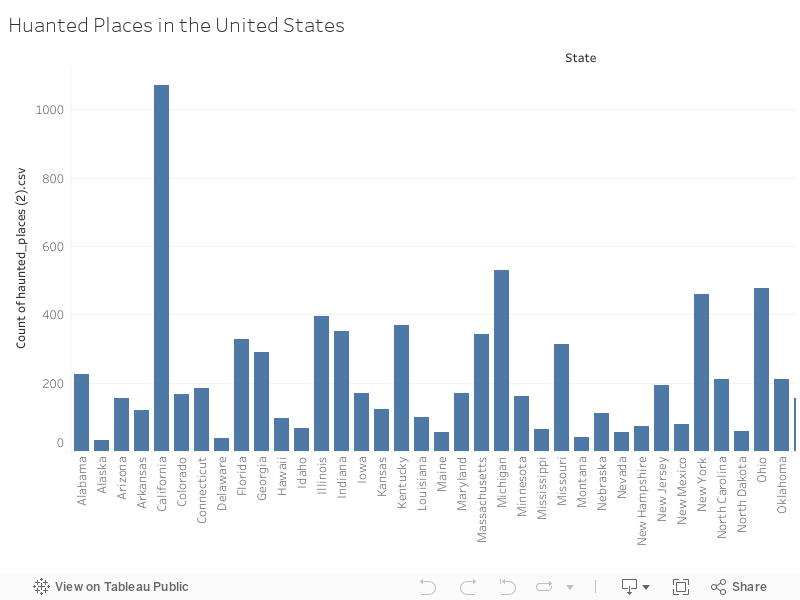
<script type='text/javascript'> var divElement = document.getElementById('viz1618577748886'); var vizElement = divElement.getElementsByTagName('object')[0]; vizElement.style.width='100%';vizElement.style.height=(divElement.offsetWidth*0.75)+'px'; var scriptElement = document.createElement('script'); scriptElement.src = 'https://public.tableau.com/javascripts/api/viz_v1.js'; vizElement.parentNode.insertBefore(scriptElement, vizElement); </script>I would then go on to pick a few specific states. Those with a larger number of hauntings like California, Texas, Ohio New York, and a few others, as seen in the chart for the main part of my essay. Here, I will make some more comparison charts or maps and add in the descriptions and explanations of the hauntings in the essay part of the project. I know I will have to look at the population of each of these places to show the comparisons between the number of hauntings and the types of hauntings for each of the specific states I look at. I am hoping these comparisons will show similar numbers and types of hauntings in different states. The end goal is to show that every state has some sort of ghost story, an eye witness to a haunting, or at least a legend of a haunted place and that there are several similarities between hauntings in different these states, despite the distance between and context of the locations.
One reply on “Module 10: Work”
For your visualization, think about how to organize your information visually to make the argument apparent–just like in an essay you wouldn’t throw out all your primary sources in a muddle and let the reader work it out, in a visualization things should be organized in some way to help guide the reader. Tableau has a built in sort function that can do most of that work.
One other thing to keep in mind for your write up is that your data isn’t counting hauntings, it’s counting observed hauntings–remember the example of earthquakes vs observed earthquakes. (This is part of the reason comparison against population is helpful). The first chapter of this book might be helpful for this.