Here is my data set: https://github.com/elisabethmtatum/1770sample
Cleaning– I’ve spent the last two weeks cleaning my data and beginning to extend it. My first focus was cleaning the names. In order to show more connectivity in my network, I need to rectify variant spellings, so I could track the same person across multiple transactions. I started by cleaning full names together, which helped get the most obvious different spellings. While looking for names that phonetically sounded similar, or had one letter different, I also had to consider whether names were anglicised (for instance Johannes–> John, Jacobus–> Jacob. The second time i went through, I cleaned last names and first names separately to catch names that were not picked up by the algorithms in Open Refine. When cleaning, i stayed on the side of caution, not wanting to get overzealous with clumping people together when I don’t have additional biographical data to verify.
Extending–I’ve extended my data by using the genderize API to assign gender. For this, I needed to then go through manually and make sure that some obscure male names were not recorded as female. I still have a handful of people in my sample whose gender I have labeled as unknown.
I’m still working on a code to scrape info from Find a Grave. If successful, I may add a presumed location to each creditor and debtor, based on the occurrence of last names and burial places in Dutchess County.
Visualizations– The first visualization I know I want to make is a network model. I’ve played around with my data by plugging it into the Quaker Networks D3 visualization (here’s the link if it doesn’t show below). I haven’t yet figured out how to add different formats, but I would like my final visualization to do the following:
—zoom the svg in and out to see the full network
—create a directed network with two different colors to represent whether the money is owed by or owed to the insolvent debtor
—thicken the width of lines depending on the amount owed or owing
—organize nodes (if possible?) by geographic location. Can a network model overlay a map?
—Add a sliding filter for dates. This is probably not necessary for this small sample, but I’d like to know how to do it for my data in the future.
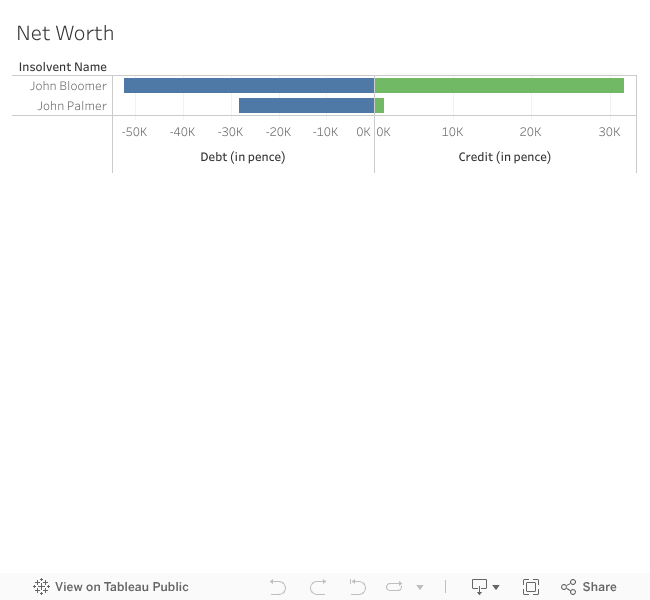
For my second visualization, I’d like to have a representation of how much each insolvent debtor’s net worth. I’m thinking that maybe a mirrored bar chart (like a population pyramid) might be an interesting way to show this.
2 replies on “Module 9: Work”
Network looks great! The code for my All One People network with year slider and zoom is here: https://github.com/mkane2/allonepeople/blob/master/barclay.js It’s not written for Observable, but should translate. A stripped down version of the same network without slider or zoom is on Observable here https://observablehq.com/@mkane2/all-one-people; I’ll work on translating the slider and zoom over for you so you can see how that looks.
For coloring by debtor/creditor, you’ll need to add a column identifying this in the nodes spreadsheet you give to networkX, if you haven’t done so yet. (And it will depend on a person only ever being a debtor or creditor, or having a third identifier for someone who was both) Similarly you’ll need a location column as well.
For the map overlay, are you thinking something like this: https://www.d3-graph-gallery.com/graph/connectionmap_multi.html or these https://www.data-to-viz.com/story/MapConnection.html ? That’s doable, but you will probably need to figure out a default location for people who don’t have an imputed location.
To style the links by pence_owed, you’ll need to move pence_owed into your edges sheet before you give it to networkX. Whether it makes sense to attach pence_owed to the creditor or debtor I think depends on who you have set up as the source and who the target.
For the credit vs debit bar chart, think about organizing that in some way so that you can pull more meaning from it–for example, sorting it by amount owed, or further breaking it down by location if you can get the find a grave scrape to work. It could be interesting, but it will probably be hard to read for the number of people you’re working with so you’ll want to figure out some way to make it more readable at first glance.
I’ve added zoom functionality to the Quakers network here https://observablehq.com/@mkane2/force-directed-graph-with-zoom-and-slider . I’ve removed all the comments except for comments on new stuff, where I’ve just added ZOOM. This also steps back the D3 version number to 5 rather than 6, since I’m less familiar with v6.
I haven’t finished building the time slider functionality yet, but I’ll let you know when I have an example to show you. One thing to keep in mind for the year functionality is that you’ll need to attach year information to your edges sheet (something like source: john smith; target: gene roberts; year: 1722) so that there’s year information. If you want your nodes to change size by betweenness/degree as more nodes enter the network like in my All One People article, you’ll need to run your networkX analysis once per year on the filtered network with only those nodes and edges that you want visible in that year. This is doable with a filter and a loop, but it’s kind of a pain in the ass.