Here is my tableau assignment:
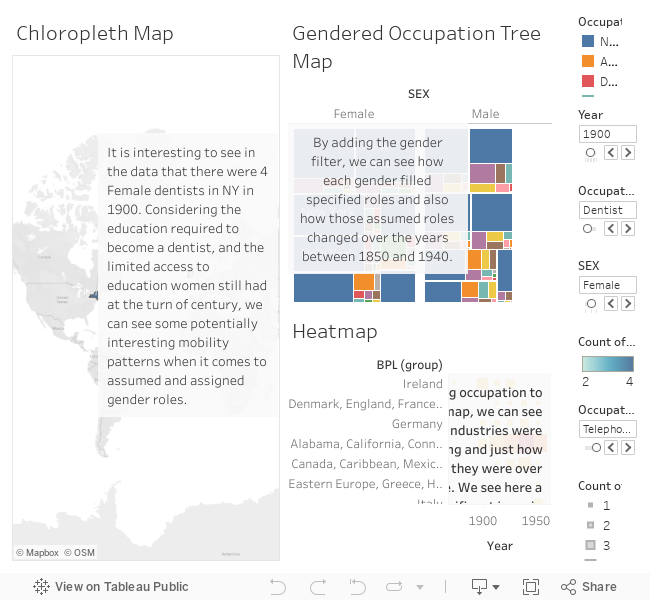
In my Chloropleth map, I added an occupation slider, along with a gender slider, so we could map how assigned and assumed gender roles developed over the course of time. This then ties to the heat and tree maps to show how industry and opportunity grew in NY, attracting workers from around the world, of both the male and female gender, and cutting across a number of industries.
The tableau work has been my favorite part of the course so far. I enjoy creating the visuals for the data and understanding how to use different filters to show movement and change over time. I tend to think that this type of visualization will be beneficial to my own research as I’ll be able to visually and textually explain the economic change over time.
<script type='text/javascript'> var divElement = document.getElementById('viz1616988055493'); var vizElement = divElement.getElementsByTagName('object')[0]; if ( divElement.offsetWidth > 800 ) { vizElement.style.minWidth='420px';vizElement.style.maxWidth='650px';vizElement.style.width='100%';vizElement.style.minHeight='560px';vizElement.style.maxHeight='860px';vizElement.style.height=(divElement.offsetWidth*0.75)+'px';} else if ( divElement.offsetWidth > 500 ) { vizElement.style.minWidth='420px';vizElement.style.maxWidth='650px';vizElement.style.width='100%';vizElement.style.minHeight='560px';vizElement.style.maxHeight='860px';vizElement.style.height=(divElement.offsetWidth*0.75)+'px';} else { vizElement.style.width='100%';vizElement.style.height='1350px';} var scriptElement = document.createElement('script'); scriptElement.src = 'https://public.tableau.com/javascripts/api/viz_v1.js'; vizElement.parentNode.insertBefore(scriptElement, vizElement); </script>