Here is my assignment: (sorry it is late- I just saw it was still a draft in my posts!)
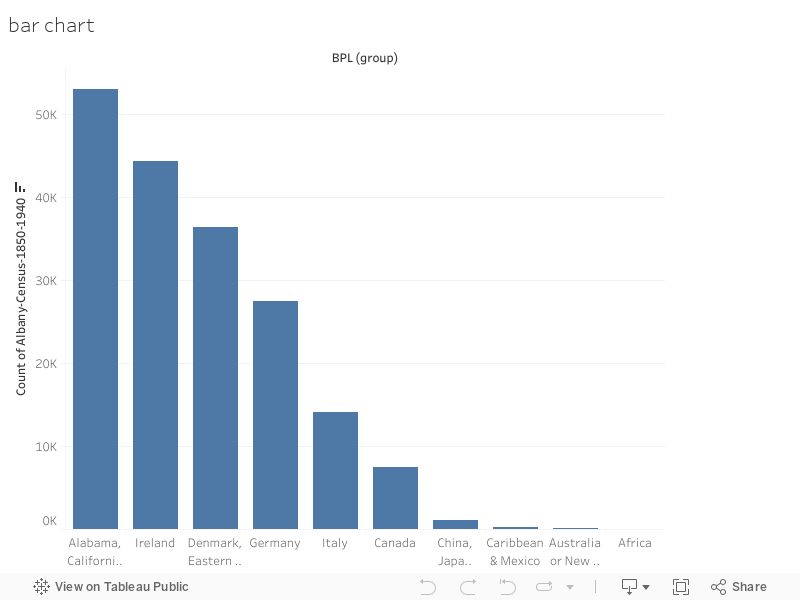
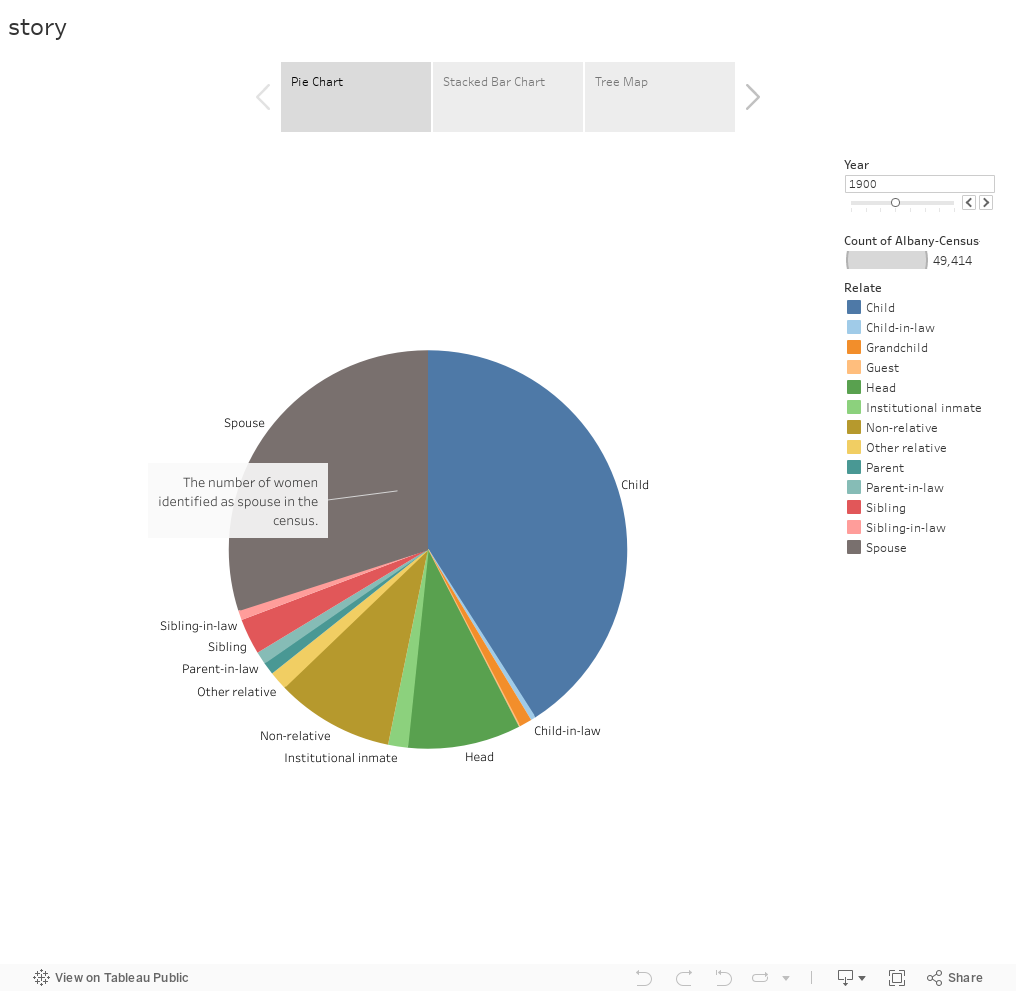
In my pie chart, I charted the relationships of the women in the 1850-1940 Albany census data. I included a slider to filter by year.In my stacked bar chart, I charted the relations of people in the 1850-1940 Albany census data by year. In my tree map, I mapped the occupations of men and women in the 1840-1950 Albany census data, with a filter to remove or include whether an occupation was listed.
In this course, I enjoyed the data cleaning the most- it was strangely satisfying! I enjoyed the other aspects (even colab!), but there is something just reassuring about knowing the language of what I am doing already. I did enjoy this Tableau assignment as well!