<script type='text/javascript'> var divElement = document.getElementById('viz1616092015154'); var vizElement = divElement.getElementsByTagName('object')[0]; vizElement.style.width='100%';vizElement.style.height=(divElement.offsetWidth*0.75)+'px'; var scriptElement = document.createElement('script'); scriptElement.src = 'https://public.tableau.com/javascripts/api/viz_v1.js'; vizElement.parentNode.insertBefore(scriptElement, vizElement); </script>Additional Visualization Narration
Additional Vis #1 – In this pie chart of Albany, NY population data between 1850 and 1940, I used race to delineate population percentages for the given period. I excluded “White” data responses to focus the vis more closely on minority populations, and colored it according to race. I also added a slider to allow viewers to compare the visualized data throughout the given period.
Additional Vis #2 – In this tree map of occupation data for Albany, NY between 1850 and 1940, I colored the graphic by gender to demonstrate the degree of gendered diversity in such occupations over time.
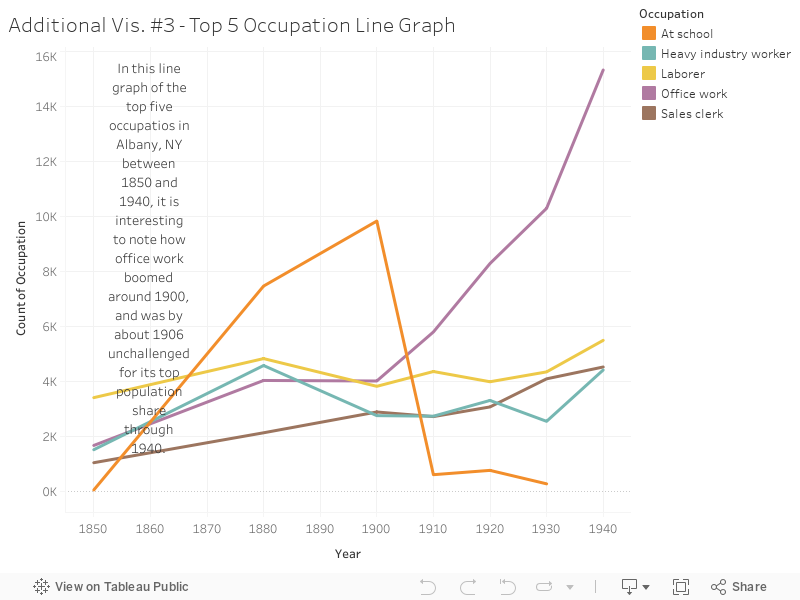
Additional Vis #3 – In this line graph of occupation data for Albany, NY between 1850 and 1940, I chose to focus for the sake of readability on the top five occupations for that period. I assigned years to the X-axis and respondent count to the Y-axis. I colored the lines according to occupation.
Reflecting on the Semester So Far…
To this point, my favorite skill has by far been web page design. This actually really surprises me given the degree of attention to detail necessary to avoid breaking the whole thing with an errant key stroke, but nevertheless this has been my experience. There seems to be something almost meditative about working procedurally through the code. I realize many of the other skills we’ve learned and practiced thus far are likewise procedural (such as data cleaning and vis creation), but still the HTML and CSS coding stand out for me. (Data vis creation is a reasonably close second).