
<script type='text/javascript'> var divElement = document.getElementById('viz1615311274798'); var vizElement = divElement.getElementsByTagName('object')[0]; vizElement.style.width='1016px';vizElement.style.height='1014px'; var scriptElement = document.createElement('script'); scriptElement.src = 'https://public.tableau.com/javascripts/api/viz_v1.js'; vizElement.parentNode.insertBefore(scriptElement, vizElement); </script>In my bar chart, I showed the number of Albany residents employed in a certain occupation. I Each bar is colored to represent a different occupation and included a slider to filter by year.
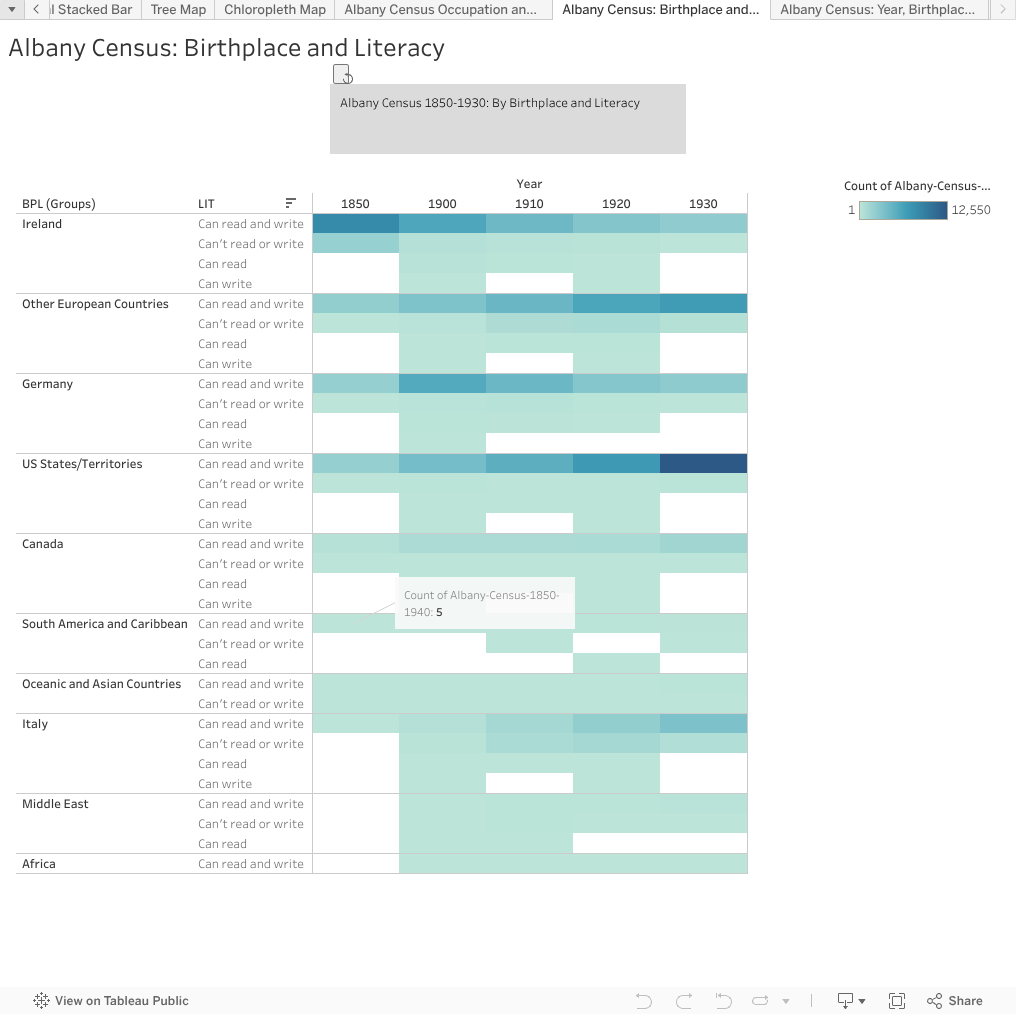
<script type='text/javascript'> var divElement = document.getElementById('viz1615311647580'); var vizElement = divElement.getElementsByTagName('object')[0]; vizElement.style.width='1016px';vizElement.style.height='1014px'; var scriptElement = document.createElement('script'); scriptElement.src = 'https://public.tableau.com/javascripts/api/viz_v1.js'; vizElement.parentNode.insertBefore(scriptElement, vizElement); </script>My heatmap visualizes the birthplace and level of literacy of Albany residents, except New York, from 1850 to 1930. The data visualization uses a color scale to illustrate the number of Albany residents in relation to their level of literacy and birthplace. The darker the color, the higher the number of residents fall into the specific category.

<script type='text/javascript'> var divElement = document.getElementById('viz1615311701711'); var vizElement = divElement.getElementsByTagName('object')[0]; vizElement.style.width='1016px';vizElement.style.height='1014px'; var scriptElement = document.createElement('script'); scriptElement.src = 'https://public.tableau.com/javascripts/api/viz_v1.js'; vizElement.parentNode.insertBefore(scriptElement, vizElement); </script>My pie chart compares the gender in proportion to the birthplace of Albany residents, except New York, from 1850 to 1940. Each “slice” of the two separate pie charts is colored and labeled in relation to the birthplace of the Albany residents accounted in the census. I also included a slider to filter the pie charts by year.
Out of all the assignments thus far, I have to say I enjoyed this week’s Tableau assignment. I am not too sure why, perhaps it was because of the lack of coding involved or because I am visual learner (probably a bit of both). Either way, this week it was cool to get a “behind-the-scenes” look at data visualization. I especially liked the Chloropleth portion of the assignment because out of the DH projects I have seen in class or used when TAing, I find mapping projects that illustrate geospatial data the most compelling. It’s nice to know that these sorts of visualization tools are not so scary once you have cleaned the data you want to work with. It was also fun to be able to mess around with the different variables to see what wacky visualization would appear without being afraid of breaking the dataset.
One reply on “Module 5: Using Data”
Images look good, but there’s something up with your embeds that looks like you grabbed the wrong code–from your tableau profile page for the workbook (like this https://public.tableau.com/profile/m7463#!/vizhome/Datavizexamples/Bar), there should be an icon with three dots in the lower right corner. When you click that, it will bring up a box with an embed code and a box with a link url. Grab the embed code and bring it back here.
And yes, tableau is great because it doesn’t touch your data or change it in any way (although that can be kind of annoying because you can’t clean or export groupings if you need them in another program)