Between 1784 and 1793, James Madison kept detailed records documenting the meteorological phenomena he observed at his home of Montpelier. Madison was partially inspired in his efforts by fellow founding father Thomas Jefferson who also kept meticulous weather records on his own Virginia plantation, and partially by a sense of national pride (Center for Digital Scholarship, APS). As the new United States of America was working to establish its diplomatic and political identity, so too was it attempting to craft a cultural identity to be shared with the broader world. A substantial part of that cultural identity was rooted in the assertion that the United States had strong agricultural lands and an inviting climate (Center for Digital Scholarship, APS).
Scholars of early American meteorological records have used these resources to gain insight into labor and trade practices in newly American plantations (Mekuc). Others using Madison’s data have placed Montpelier within a globalized agricultural network (Nebiolo). However, these records can provide critical information about the ways in which early Americans understood the seasonality of agricultural foodways. This can, in turn, have a substantial impact on the ways public historians present historical narrative. By turning to hyperlocal datasets, broadly thematic topics of identity, labor, and globalization become increasingly nuanced and relevant.
Was Madison’s eighteenth century Montpelier truly cooler than it is today?
It has been widely accepted that eighteenth and early nineteenth century America was slightly cooler than at present. Proponents of the Little Ice Age theory have argued that temperatures in North America were substantially lower due to glacial and climatic causes (Grove; Matthews & Briffa). There is also a general understanding that climate change has led to unpredictable modern weather patterns.
To answer this question we need to compare Madison’s records with modern meteorological trends.
Montpelier is located in modern day Montpelier Station, Virginia. The NOAA data was collected 10 miles to the northeast at the Orange County Airport.
map via Google, n.d.
Both Montpelier Station and the Orange County Airport are located within the far western Piedmont region of Virginia and are located in the modern day USDA agricultural zone 7a.
Map via The Regions of Virginia, Virginia Museum of History & Culture
This region of the Virginia Piedmont is situated between the coastal tidewater region and the Blue Ridge Mountains. Due to its unique geography it tends to be slightly cooler than the tidewater, yet warmer than the Blue Ridge. It also tends to receive an additional 3 to 5 inches of rain per year than these other locations (The Regions of Virginia).
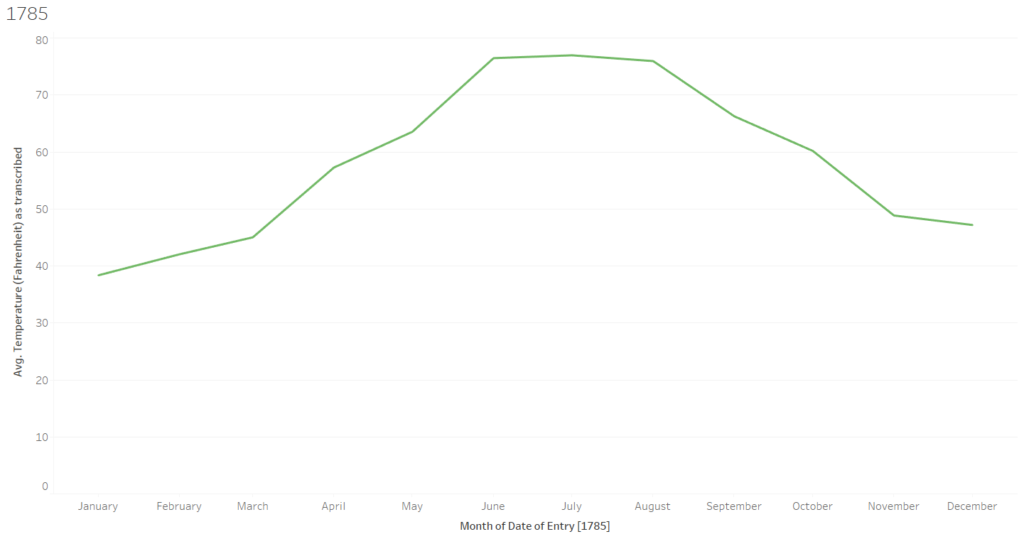
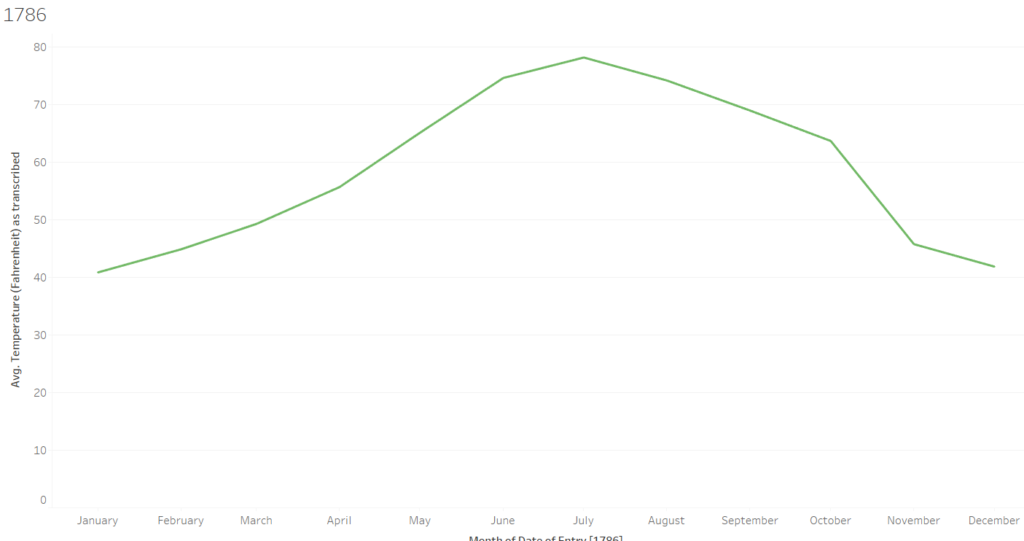
From 1785 through 1788, January was the coldest month with an average temperature of 41.5 degrees.
July was the warmest, with an average temperature of 75.5 degrees. August was a close second hottest month with an average temperature of 73.75 degrees.
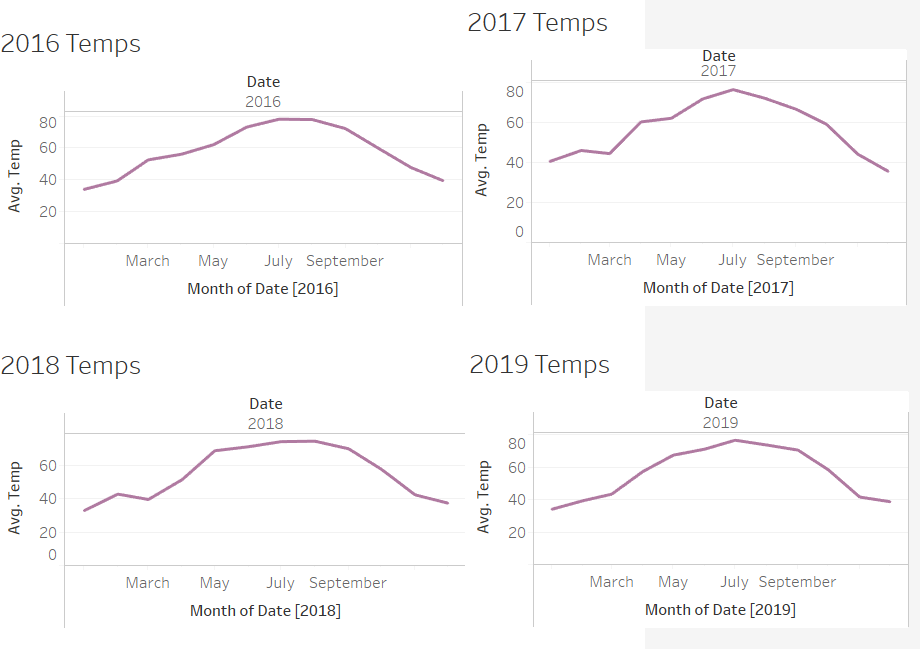
Similarly, from 2016 to 2019 the coldest month continued to be January. It held an average temperature of 35.33 across the four years.
July continued to be the warmest month, with an average high of 76.28. Again August ranked a close second warmest month with an average high of 74.48.
| Summer High | Month/Year |
|---|---|
| 76.9 | July 1785 |
| 78.14 | July 1786 |
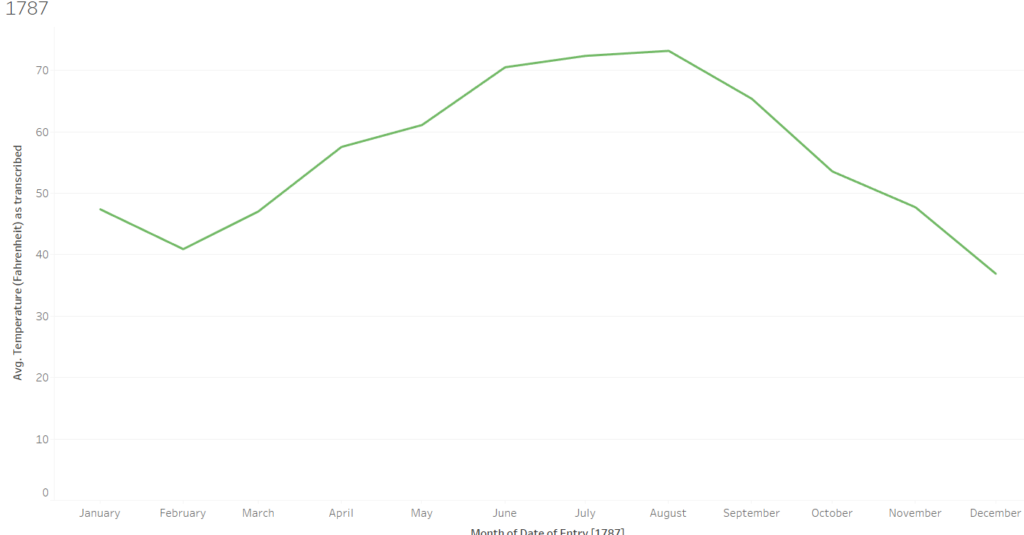
| 72.37 | July 1787 |
| 74.79 | July 1788 |
| 75.5 | Historical Summer High |
| Summer High | Month/Year |
|---|---|
| 78.07 | July 2016 |
| 76.29 | July 2017 |
| 74.12 | July 2018 |
| 76.62 | July 2019 |
| 76.28 | Modern Summer High |
Contrary to expectation, summertime temperatures did not indicate any drastic climatological change. The average summer high across was less than one degree lower during our eighteenth century sample versus our modern sample.
Interestingly, though, historic winters were nearly six degrees warmer. This is a substantial enough buffer to permit a noticeable change in agricultural practices.
What implications did climate have for agricultural decision-making?
Madison made multiple annual observations about fruit, flowers, vegetables, animals, and various other natural phenomena such as flooding and visibility of the aurora borealis. His most notes about agriculture at Montpelier reveal a varied schedule of planting and harvesting of both cash crops and those for consumption on his plantation.
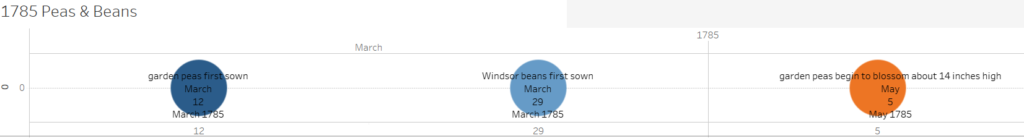
His most consistent agricultural records between 1785 and1788 concern peas and beans which were used as a food item for his table, as a way to feed his enslaved laborers, as fodder for his livestock, and as trade goods.
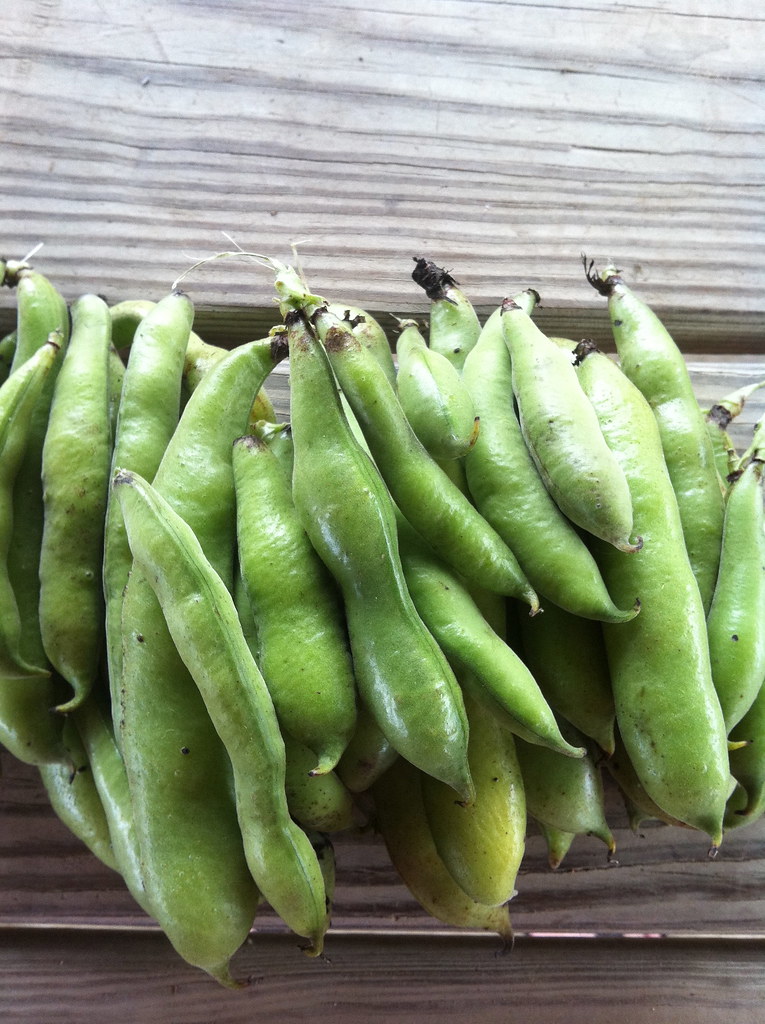
Windsor beans, like these, were commonly used as fresh and dried produce. Madison may have been growing them for trade or as a food item for the enslaved workers on his plantation. He does not list them as being served on his table at Montpelier.
Madison does not note the type of pea raised on his plantation other than specifying that some are “forward peas” and some are “Indian peas.”
“Fava Bean/Windsor Bean” by John and Anni is licensed under CC BY-NC-SA 2.0
In 1785 peas were first planted in the second week of March, when the temperature was averaging mid-40s. Windsor beans, a bush style fava bean that can be eaten fresh or dried for later use, was first planted in late March when the temperatures were in the 50s. The temperature steeply increased in April and May leading to peas blossoming the first week of May.

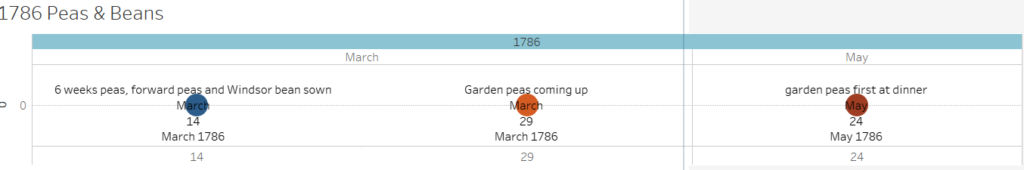
The following year, peas were again planted the second week of march and are noted to be sprouting just two weeks later. The Madisons enjoyed their first fresh peas at dinner on May 24th. There similar temperature trends between 1785 and 1786, with planting taking place when temperatures were averaging in the mid-40s, and steep climbs in temperature through April, May, and June.

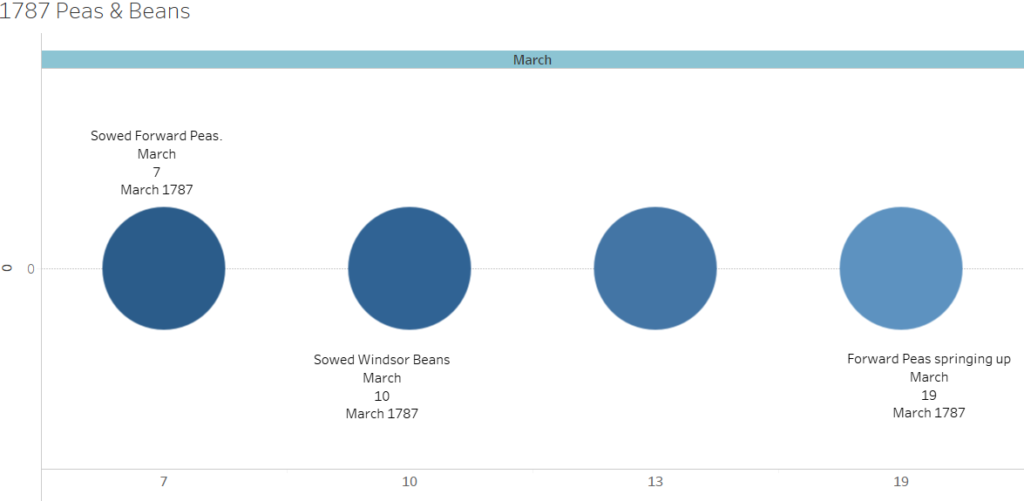
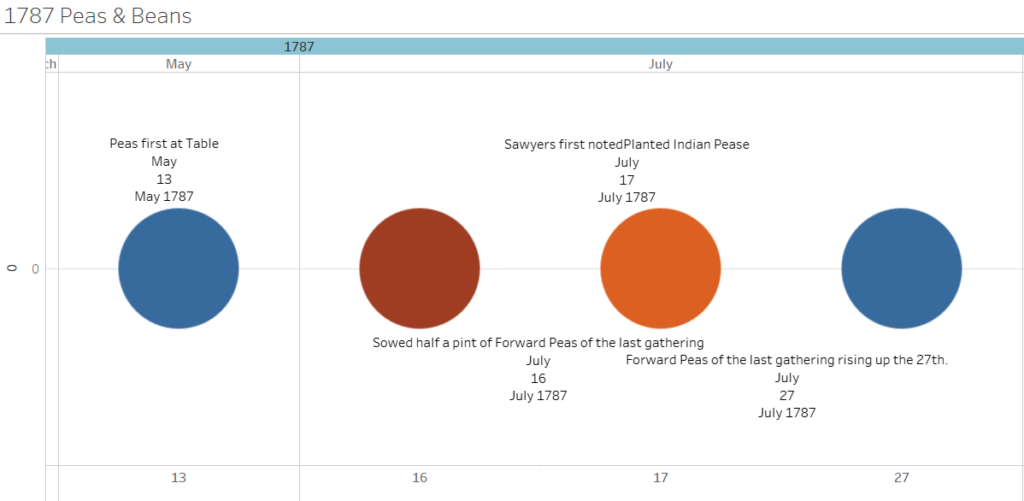
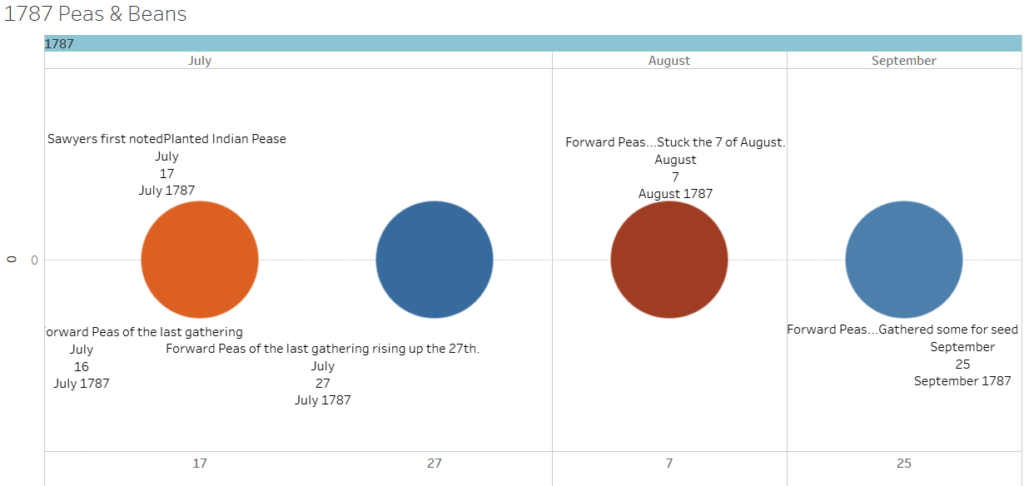
1787 proved to be a very fruitful year for peas and beans at Montpelier.
On March 7th peas were planted, Windsor beans were planted on the 10th, additional peas and Windsor beans were planted on March 13th, and by March 19th the first of the forward peas (those planted early, on March 7th) have sprouted.
It was again relatively cold, in the mid-40s, which is likely beneficial to these cool-weather loving crops.

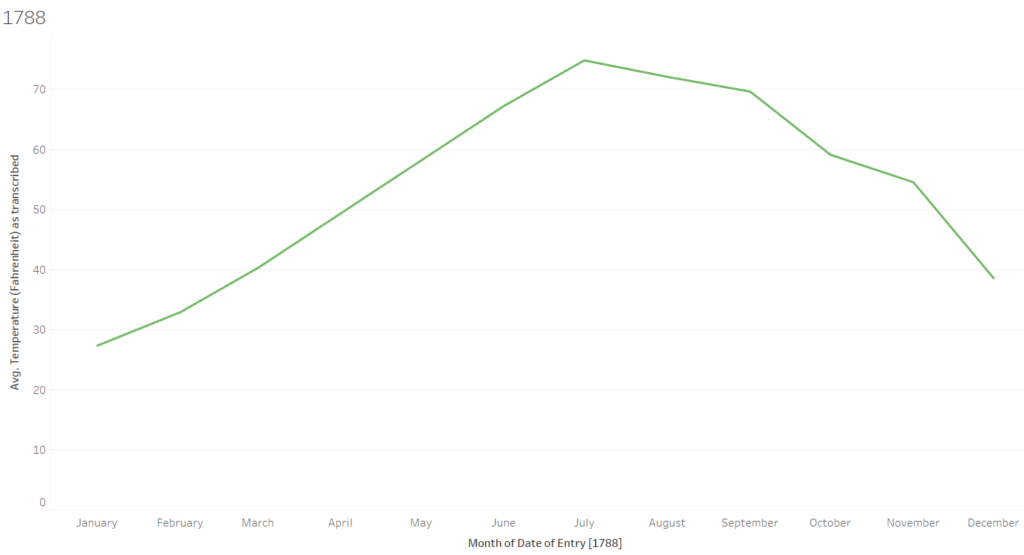
Madison’s pea and bean endeavors were substantially smaller in 1788, likely due to the fact that March was unseasonably warm. On March 13th when the first batch of peas were planted, it was nearly 70 degrees already.

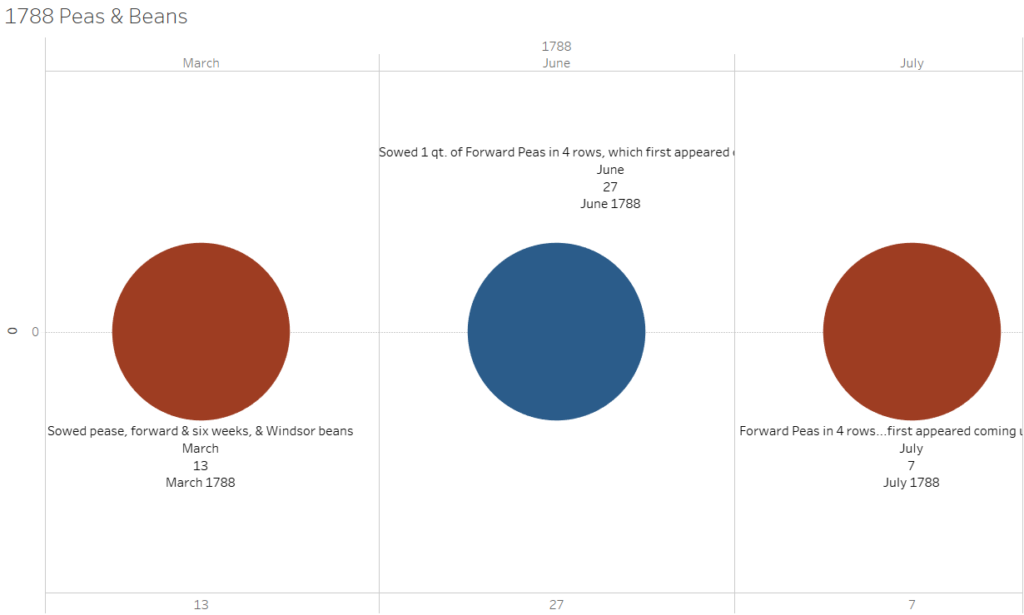
Based on this data, it is clear that meteorological trends substantially impacted agricultural practices in eighteenth century Virginia. Madison capitalized on the extra cool spring of 1787 to sow multiple pea and bean plantings. The next year’s unseasonable spring warmth, however, made repeating this agricultural success impossible.
Where does that leave us?
This is just a small slice of Madison’s accumulated agricultural data. Taken as a whole, it is a strong body of evidence for discussions of seasonality and the historically seasonal table.
Countless historical sites discuss the seasonality of produce as it relates to prescribed seasons: spring is a time for planting peas and beans regardless of your geographic location. Peas and beans are planted in during New York’s spring, just as they are planted during Virginia’s spring. However, these records indicate that the seasonality of planting, harvesting, and consuming is more dependent on temperature variables than they are on a month of the year. Seasonality for Madison meant taking advantage of the cool summer if 1787 to plant additional pea crops.
Without this basis in micro level history, macro level interpretation at historic sites easily becomes meaningless. These records demonstrate that seasonality was more than a concept or theme in eighteenth century Virginia. It had a very real impact on the lives of every individual who lived at Montpelier. Turning to ultra-local information is critical in informing our understanding of broadly historical themes and trends. Taken together, this data has the potential to inform on the ways that that meteorological phenomena impacted the everyday lives of early Americans, their farming and eating practices, and the very ecology of the world in which they lived.