An Analysis of Women’s Employment in 1930 and 1931
Data Set: 1930/31 Time Diary from College Educated Women in the United States
The Data Set
The 1930/31 Time Diary from College Educated Women in the United States is the second phase of a research project on white, female homemakers conducted by the United States Department of Agriculture. In the first phase of the study, the Department of Agriculture collected data from women in non-farm and farm households between 1924 and 1928. The second phase of the data focused on 692 married alumnae of the Seven Sister colleges, which include Barnard, Radcliffe, Vassar, Bryn Mawr, Mount Holyoke, Smith, and Wellesley, from 1930 to 1931.
The diaries documented numerous factors about the women and their daily lives, including …
Age
Martial Status
Employment
Employment Status (Part-time/Full-time)
Home Ownership (Rent or Own)
Size of Household
Age of Children
Setting/Location (Urban or Rural)
State
Hours Worked Per Week (Paid/Employment)
Time Spent on Housework/Tasks
Specific Tasks/Housework Activities
The data on housework and activities was collected in five minute intervals. Each of the activities were self-described by the women and every aspect of the data was self-recorded on paper forms.
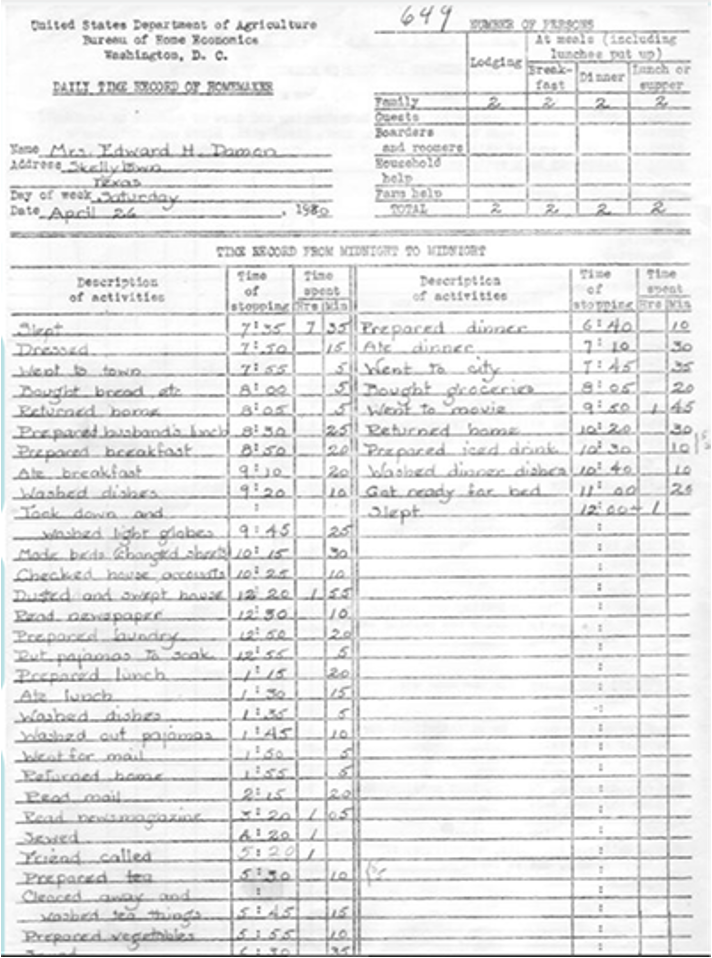
The paper time diaries were digitized by Dr. Teresa Harms for the Centre for Time Use Research. Out of the 692 women who participated in the study, only 75 complete time diaries were recovered (Harms). In her research, Dr. Harms utilizes additional primary records, like census data, to supplement the time diaries and fill in any missing information. Dr. Harms explained that there were cases where information was incorrect because the women moved soon after data collection or their names were misspelled (Harms). The published data set does not include the names and specific information that Dr. Harms used in her personal research.
Methodology
Before analyzing the visualizations below, it is important to note that I used both a sorted and unsorted version of the data set. The sorted version of the data set does not include all of the entries that were recorded. Each woman had multiple entries for multiple days of the week, in some cases there were over 200 entries per woman. In order to collect basic information, like how many women were employed or how many women were teachers, I had to erase the duplicates in the data set so each woman was only represented once. However, this sorted data set erases any information about time, date, and activities. The second version of the data I used contained all of the entries that were published. This data set was used for the visualizations regarding time and hours worked per week. Anytime I reference “hours worked,” I am referring to employment, not housework.
Limitations
The data set has multiple limitations. The 1930/31 time diaries were only collected from married, alumnae of the Seven Sisters. This excludes unmarried women, women who received secondary education elsewhere, and women who did not receive secondary education. Consequently, the conclusions from the data can only pertain this specific set of women who had a level of privilege. The Department of Agriculture noted that the women included were in a “favorable economic situation,” even with the Great Depression (U.S Department of Agriculture, 1).The data set only included white homemakers, so women of color were not represented in the data’s conclusions either.
Additionally, the digitized data set does not have any identifiers for the individual women; the Individual IDs listed on the data sheet reference the day of the week that the data was collected, not the woman who the data pertained to. Consequently, it was difficult to isolate the individual women for analysis. The original time diaries included the women’s names, but they were not included on the public, digital data set.
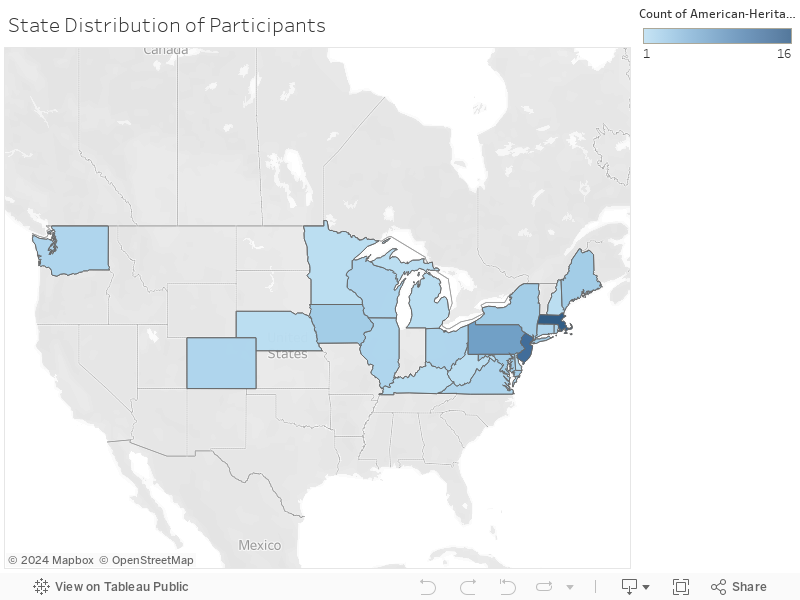
This map that shows where the participants of the study resided. The majority of the women lived in Massachusetts, New Jersey, and Pennsylvania. While most states had two or three women participate in the study, the sixteen women who participated from Massachusetts are reflective of that fact that three out of the Seven Sisters are in their home state.
Argument
In 1944, the Department of Agriculture published “The Time Costs of Homemaking: A Study of 1500 Rural and Urban Households.” The article analyzes both the first and second phase of data collection through the lens of housework. While the data set was collected with the purpose of analyzing housework, the supplemental information about employment in the 1930s peaked my interest. At the start of the Great Depression, I was not expecting to see information about fields of employment growing and women working multiple hours per week. An analysis of the Time Diaries from College Educated Women highlights larger employment trends in the United States during 1930 and 1931.
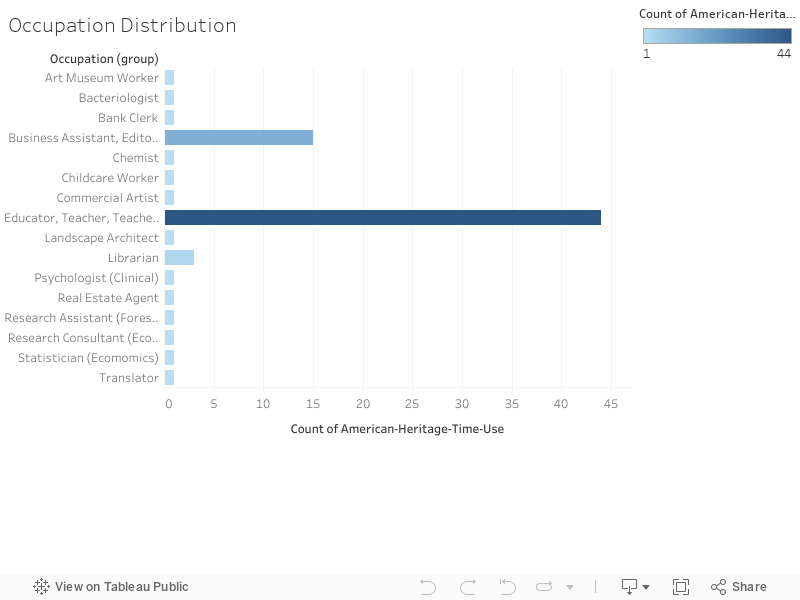
This bar graph shows the various occupations of the women in the study. These women were college educated and held what would be considered skilled professions. As a result, these women were privileged and less likely to loose their job during the early years of the Great Depression (Rury, 2). However, women who were brand new to the workforce, older women, and women who were not trained in a skilled profession still faced high levels of unemployment throughout the 1930s (Blackwedler, 112).
In the 1930s, women’s role in the workforce grew but the labor market was not growing at a rate to keep up with the demand for jobs (Blackwelder, 112). Most new jobs created were in clerical work and younger, college educated, experienced women were in the best position for employment (Blackwelder, 112, 116; Rury, 2). With the demand for jobs, there was an increase in racial discrimination in the job market. White women were more likely to be employed and less likely to lose their job. Additionally, many white women were applying for jobs that would have previously been viewed as undesirable and taking jobs that women of color previously held (Blackwelder, 112 & 116).
Additionally, as more women became college educated and joined the workforce, there was an increase in the sexual division of labor in the workplace (Rury, 2-3). As we can see on this chart, the majority of the women were employed as educators, social workers, and in clerical work – jobs that are still stereotyped as “women’s work” today. Historians argue that the increase of women’s secondary education allowed for growth in the fields of teaching, clerical work, and other white collar jobs (Rury, 2). The job distribution in the data set shows the growth in those fields among the Seven Sisters alumnae.
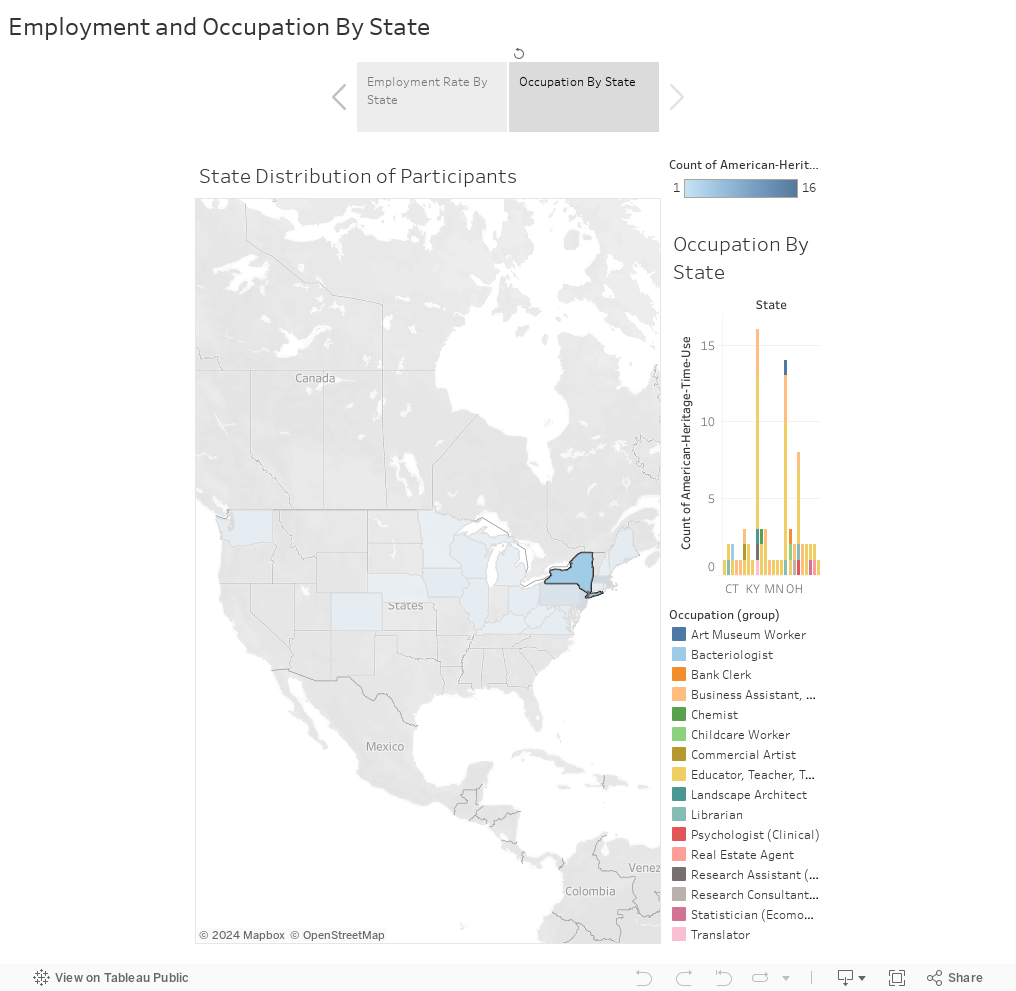
The visualization story above highlights the employment rate of each state and the occupations of the women who lived there. New Jersey and Massachusetts had the most women involved in the study and many of them were unemployed. In Connecticut, Washington D.C, and Nebraska, all of the women who participated in the study were unemployed. On the contrary, all of the women who lived in Delaware, Michigan, Minnesota, New Hampshire, Rhode Island, and West Virginia were employed.
The second visualization on the story is an interactive map that allows viewers to click on each state and see what occupations the women held. In Massachusetts, the state with the most representation, ten out of sixteen women were in education and three others were in clerical work.
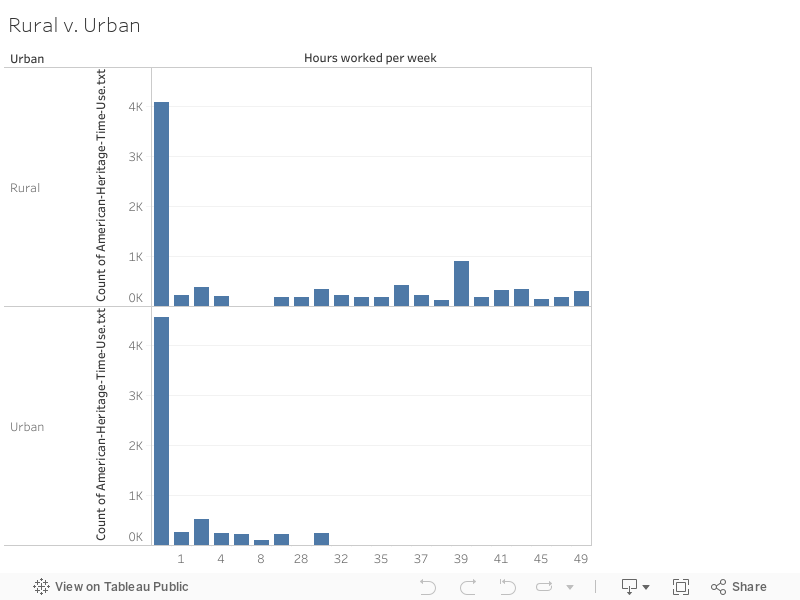
The bar graph above compares the hours worked per week by women who lived in rural settings and women who lived in urban settings. The Department of Agriculture did not define what qualified as an urban vs. rural setting. The graph shows that women who lived in rural settings worked more hours per week than their peers who lived in urban settings.
In addition to increased hours of employment, rural women faced increasing pressures to perform and produce on their farms. Rural areas suffered the most during the Great Depression; consequently, rural women were held to higher standards of production inside and outside of the home to compensate for the families’ financial loses. (Schwieder and Fink, 80-84).
Another consideration for this difference is that only 28 of the 75 women included in the study lived in urban settings. Women who lived in rural settings had more representation in the data set.
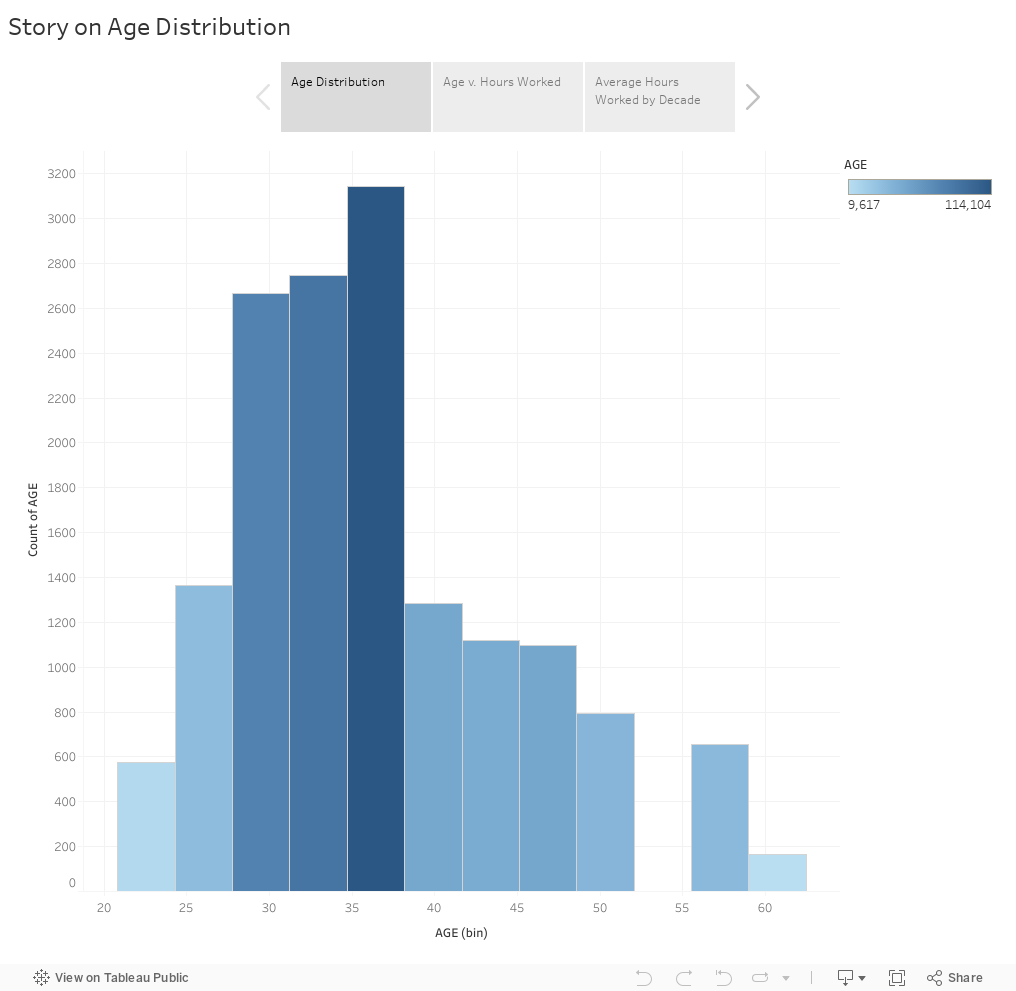
The final visualization story evaluates the age of the women and how many hours they worked per week. The first graph shows the age distribution of the women involved in data collection. As seen above, the majority of the women included in the study were in their thirties. The second graph compares the age of the women to how many hours they worked per week. This graph shows us that there was a wide distribution of hours worked, some women were working as little as five hours per week while their peers worked fifty hours per week. This graph also shows us that there is a wide distribution of hours worked regardless of age. The final treemap analyzes how many hours women worked per week by decade. This treemap highlights that while the majority of the women who participated in the study were in their thirties, women in their fifties worked more per week on average.
Historical Conclusions Supported By Data
In summary, the data set supports three historical conclusions. First, there was a sexual division of labor in the 1930s. The women included in the data set predominantly worked in white collar fields, including education, clerical work, and social work. The data supports the historiographical argument that as more women received secondary education, white collar fields grew even during periods of unemployment in the Great Depression (Blackwelder, 112; Rury, 2). Second, the data highlights that women who lived in rural settings worked more hours per week than those who lived in urban settings. Lastly, the amount of hours women worked varied greatly, but on average, women in their fifties worked more hours per week than women in their thirties.
Bibliography
“1930/31 Time Diary from College Educated Women.” Dr. Teresa Harms and IPUMS Time Use. http://blog.popdata.org/1930-31-time-diary/?utm_source=rss&utm_medium=rss&utm_campaign=1930-31-time-diary.
Abelson, Elaine S. “”Women Who Have No Men to Work for Them”: Gender and Homelessness in the Great Depression, 1930-1934.” Feminist Studies 29, no. 1 (2003): 105-27. Accessed May 7, 2021. http://www.jstor.org/stable/3178478.
Blackwelder, Julia Kirk. “Quiet Suffering: Atlanta Women in the 1930s.” The Georgia Historical Quarterly 61, no. 2 (1977): 112-24. Accessed May 7, 2021. http://www.jstor.org/stable/40580362.
Harms, Teresa. “Reviving the USDA/Purnell Act 1920s and 1930s Time Use Diary Data: Exploring Changes in Women’s Activity Patterns.” Minnesota Population Center Seminar Series. November 25, 2019. https://www.youtube.com/watch?v=1pkYSuv1uKM.
Hooks, Janet M. Women’s Occupations through Seven Decades Washington, D.c: United States Department of Labor, Women’s Bureau, 1947.
Rury, John L. Education and Women’s Work Female Schooling and the Division of Labor in Urban America, 1870-1930 Albany: State University of New York Press, 1991.
Schwieder, Dorothy and Deborah Fink. “PLAINS WOMEN: Rural Life in the 1930s.” Great Plains Quarterly 8, no. 2, Spring 1988. http://www.jstor.com/stable/23530766 .
United States Department of Agriculture, Agricultural Research Administration, and Bureau of Human Nutrition and Home Economics. “The Time Costs of Homemaking: A Study of 1,500 Rural and Urban Households.” 1944. https://www.nal.usda.gov/exhibits/ipd/apronsandkitchens/items/show/62.
Links to Tableau Workbooks: (Just in Case)
Visualizations Using Hours Worked and All Entries