Were Students More Likely to Run Away from the Carlisle Indian School if Their Tribe was in the Same Region as the School?
Background on the Carlisle Indian Industrial School
- Served as the model for off-reservation boarding schools across the U.S. and Canada
- Operating from 1879-1918, CIS enrolled over 10,000 students from across the United States
- Rather than continue the costly “Indian wars,” the founder of Carlisle, Capt. Henry Richard Pratt, convinced Congress that schools such as Carlisle should be established to assimilate and “civilize” Indian children
Reasons Why Students left the School
- Running away was not the only reason students left the school, but it was a reoccurring reason
- Reason’s students left the school:
- graduation
- running away
- ill health
- illness in family
- expulsion
- enlistment in the military
- sent home at parents’ request
- employment
To make these values comparable between regions, you must divide the number of students that ran away by the total number from that region. Then multiply by 100 to get a comparable percentage:
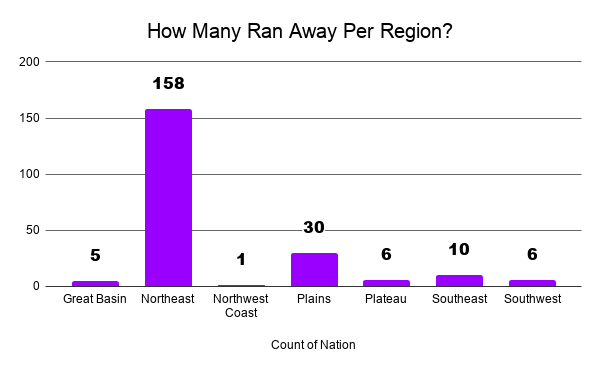
- Great Basin: 5/213= 2.3%
- Northeast: 158/2909= 5.4%
- Northwest Coast: 1/45=2.2%
- Plains: 30/1374= 2.2%
- Plateau: 6/232= 2.6%
- Southeast: 10/275= 3.6%
- Southwest: 6/475= 1.3%
The Northeast was the top region with a 5.4% run away rate.
To make these values comparable between regions, you must divide the number of students that enlisted by the total number from that region. Then multiply by 100 to get a comparable percentage:
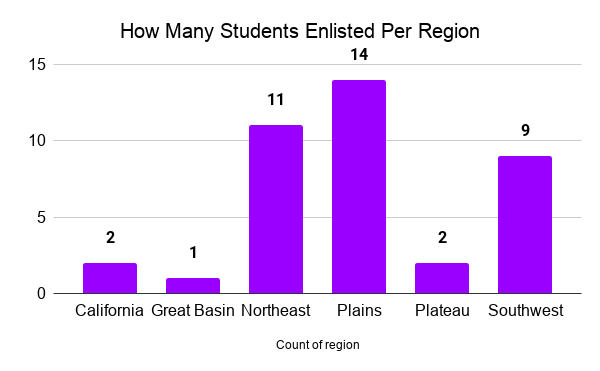
- California: 2/99= 2%
- Great Basin: 1/213= .5%
- Northeast: 11/2909= .4%
- Plains: 14/1374= 1%
- Plateau: 2/232= .9%
- Southwest: 9/475= 1.9%
California was the top region with a 2% enlistment rate.
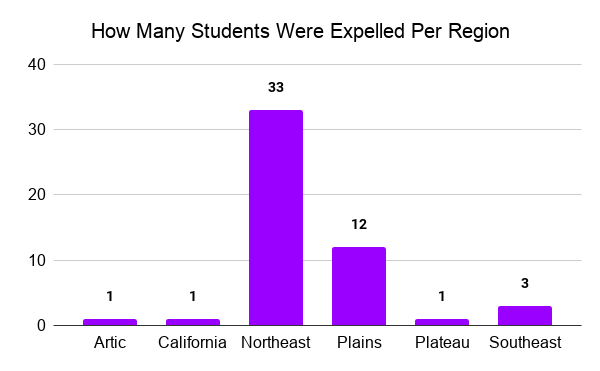
To make these values comparable between regions, you must divide the number of students that were expelled by the total number from that region. Then multiply by 100 to get a comparable percentage:
- Artic: 1/150= .7%
- California: 1/99= 1%
- Northeast: 33/2909= 1.1%
- Plains: 12/1374= .9%
- Plateau: 1/232= .4%
- Southeast: 3/275= 1.1%
The Northeast and the Southeast were tied for the top with a 1.1% expulsion rate.
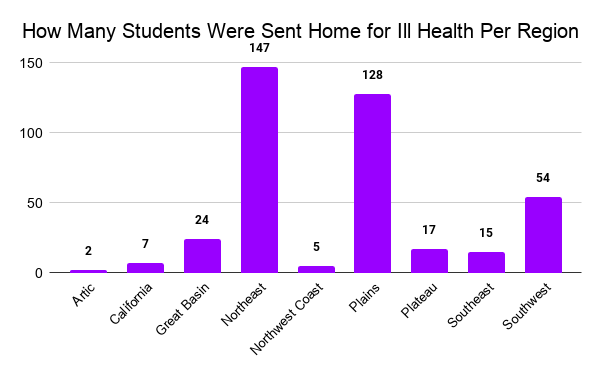
To make these values comparable between regions, you must divide the number of students that were sent home for poor health by the total number from that region. Then multiply by 100 to get a comparable percentage:
- Artic: 2/150= 1.3%
- California: 7/99= 7.1%
- Great Basin: 24/213= 11.3%
- Northeast: 147/2909= 5.1%
- Northwest Coast: 5/45= 11.1%
- Plains: 128/1374= 9.5%
- Plateau: 17/232= 7.3%
- Southeast: 15/275= 5.5%
- Southwest: 54/475= 11.4%
The Southwest was the top region with 11.4% of their students being sent home because of poor health
Argument from Project
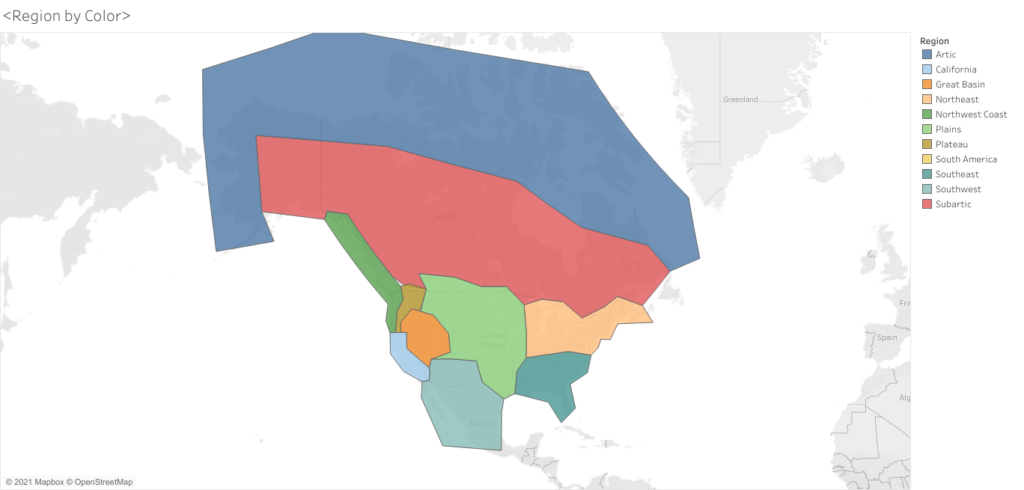
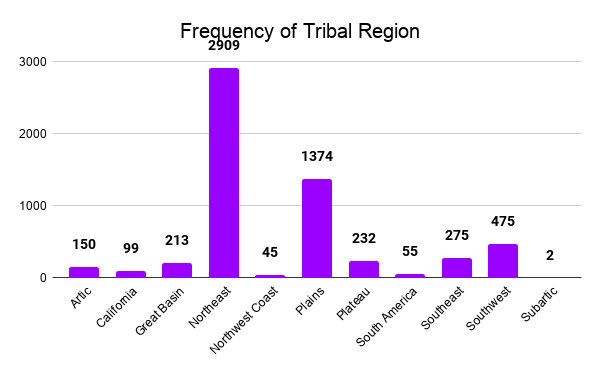
At the beginning of the project, I set out to see if students were more likely to run away from the Carlisle Indian School if they came from a tribe that was in the same region as the school, due to their homes proximity to the school. The school is located in Southern Pennsylvania, putting it in the Northeast region. These numbers are not the complete total of students that attended the school, they are from students that had a cause of leaving in their entry. It would be misleading to include students that had no cause of leaving in their entries because since we don’t know why they left, it could have been running away or any other reason, it would skew our data incorrectly one way or another. With my dataset, I was able to determine that 158 students from the Northeast ran away from the school, out of the 2909 that attended. This gave the Northeast a 5.4% runaway rate. This was the highest runaway rate by 1.8%, the next closest region was the Southeast with a 3.6% runaway rate ( 10 of their 275 attendees ran away). To be able to compare the regions to each other fairly, since every region had a different number of attendees, I took the number of students that ran away and divided it by that region’s total number of students to get a comparable percentage. That’s a good start to my argument but, to be able to say if students were more likely to run away and not just more likely to leave the school overall, you have to take a look at other causes of leaving. The other causes that I decided to look at were enlistment in the military, expulsion, and illness. The numbers overall were pretty low for enlistment in the military, but California had the most, followed closely by the Southwest. California had 2 of their 99 students enlist, giving them a 2% enlistment rate and the Southwest had 9 of their 475 students enlist, giving them a 1.9% enlistment rate. The northeast was actually last in this category at .4%, only 11 of their 2909 students enlisted. Next is the rate of expulsion. The Northeast and the Southeast tied for the top on this one, both had a 1.1% expulsion rate. 33 of the 2909 students in the Northeast were expelled and 3 of the 275 students from the Southeast were expelled. A question that may arise with this is did these students want to run away but were too afraid that they wouldn’t make it home, so they acted out so they would get sent home instead? That’s a question that would need a lot more research and data to answer. The last additional cause of leaving is illness. The Southwest, the Great Basin, and the Northwest Coast were the top 3 regions for this group. The southwest had 54 of their 475 students leave for illness. The Great Basin had 24 of their 213 students leave for illness and the Northwest Coast had 5 of their 45 students leave for illness. This gives them an 11.4%, 11.3%, and an 11.1% rate of leaving for illness, respectively. By looking at all of these numbers, you can conclude that students in the Northeast were more likely to run away than students in other regions but not more likely to leave overall, which backs up the proximity cause of running away.
Works Cited
- “Carlisle Indian School Digital Resource Center.” Overview: Teaching Modules for the Carlisle Indian School Digital Resource Center | Carlisle Indian School Digital Resource Center, http://carlisleindian.dickinson.edu/teach/overview-teaching-modules-carlisle-indian-school-digital-resource-center.
- Dickinson College Archives, Carlisle Indian School Digital Resource Center. http://carlisleindian.dickinson.edu/
- Ducksters. “Native American History for Kids: Tribes and Regions.” Ducksters, Technological Solutions, Inc. (TSI), www.ducksters.com/history/native_american_tribes_regions.php. Accessed 19 April 2021.
2 replies on “Final Project”
Just dropping a comment to let you know I saw this and it looks good. Have a good summer!
Thank you! Have a good summer!