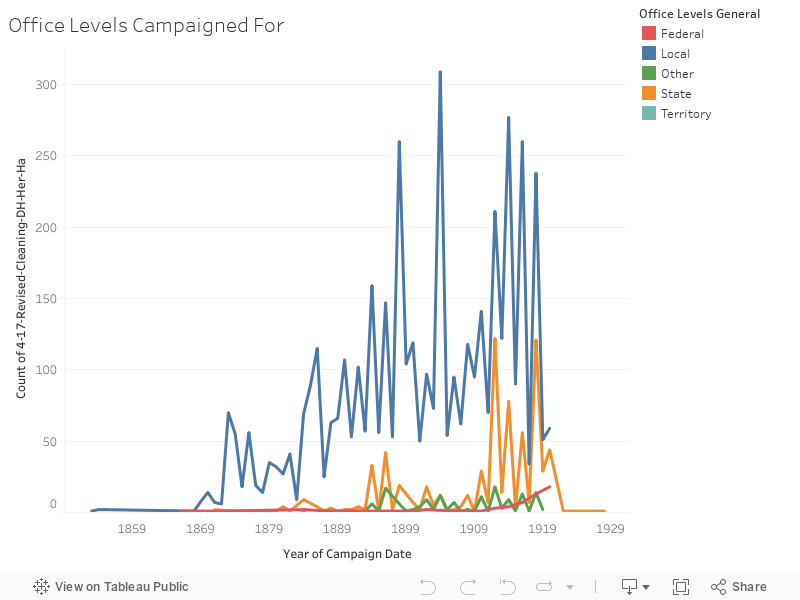
This visualization shows the types of offices campaigned for over time across all states. Our project discusses why the types of offices campaigned for changed over time.
We are splitting visualizations between us at this point and also working on a map that shows the increase of campaigns by state and year which will correspond to a timeline or time chart that reflects when those states allowed women to vote prior to 1920, if they did.
We also want to discuss the women that are not represented in this data.
After discussion, we chose to have an entry on the course blog with embedded visualizations and also photographs and ephemera related to women campaigning, working, and voting over the years 1900-1920.
Outline
“As we moved closer to the 19th amendment and in the United States, more women chose to campaign for office…”
VISUALIZATION – Line chart of different office levels.
Attitudes related to gender
POSTCARDS
“While other countries gave women the vote…”
VISUALIZATION – Map or timeline with dates of other major countries
“There is also a spike at WW1, as women took on roles normally held by men…”
VISUALIZATION- Line Chart with WW1 highlighted
LOC PHOTOGRAPHS of women working in traditional male employment during WW1.
“However, as women felt their roles expand with suffrage, they continued to seek more and higher offices…”
VISUALIZATION – Map of US with dates of when states allowed women to vote prior to 1920, if they did